 Component Importance and Time to Failure
Plots that analyze component importance and mean time to failure are provided for each system diagram that is listed in the Designs and the Library panels. This section describes the component importance measures and mean time to failure. These plots and statistics appear in the profilers panel of the report.
Note: Check boxes in the legend of each component importance plot enable you to select which components to view in that plot.
 Birnbaum’s Component Importance
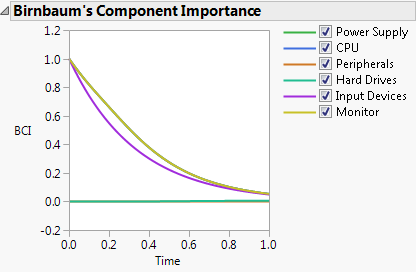
Select Show BCI to show an overlay plot of the Birnbaum’s Component Importance measures for each component of the selected system diagram. A component’s BCI at a given time is the probability that the system fails if the component fails. A component with a large BCI is critical to system reliability.
Figure 11.21 Birnbaum’s Component Importance
 Remaining Life BCI
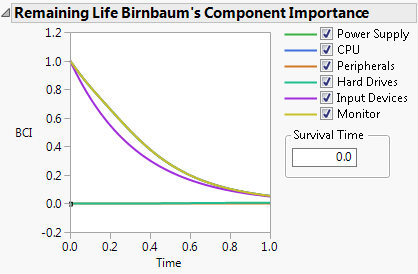
Select Show Remaining Life BCI to show an overlay plot of the Birnbaum’s Component Importance for Remaining Life. The BCI for Remaining Life is the probability that the system fails if the component fails, given that the system has survived a specified amount of time, designated as Survival Time. By default, Survival Time is set to zero, and the BCI for Remaining Life is equivalent to the Birnbaum’s Component Importance.
Enter a value for Survival Time to indicate the time to which the system has survived without failing. As an alternative to entering a value, select the small rectangle at the origin of the graph and drag it to the right to dynamically set the Survival Time.
Figure 11.22 Birnbaum’s Component Importance for Remaining Life
 Component Integrated Importance
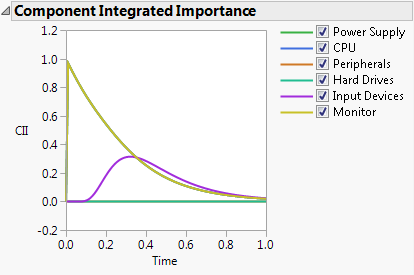
Select Show Component Integrated Importance to show an overlay plot of the integrated importance measures for the components of the Reliability Block Diagram. The integrated importance measure for each component takes into account the failure rate of the component as well as the likelihood of failing instantaneously. See Si et al. (2012).
Figure 11.23 Component Integrated Importance
 Mean Time to Failure
Select Show MTTF to view the Mean Time to Failure (MTTF) for the system.
Note: The formula that is used to calculate the Mean Time to Failure depends on the specified failure distributions and Configuration settings for each component in the system.


