Construct Display Boxes That Contain Platforms
Another type of display that you might want to construct is your own combination of results from the analysis platforms in JMP. Write the platform script inside a display box and assemble the display boxes into a window. For ease in routing messages to it later, assign the whole script to a reference.
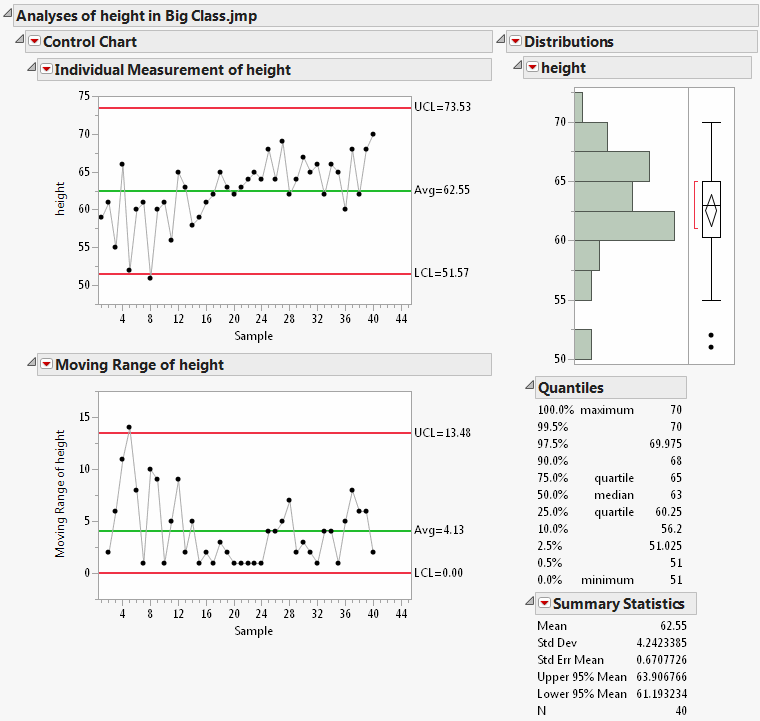
The following example creates several graphs and reports in one window:
dt = Open( "$SAMPLE_DATA/Big Class.jmp" );
csp = New Window( "Platform Example",
Outline Box( "Analyses of height in Big Class.jmp",
H List Box(
cc = Control Chart(
Chart Col( Height, "Individual
Measurement", "Moving Range" ),
K Sigma( 3 )
),
dist = Distribution( Columns( Height ) )
)
)
);
Figure 11.25 Example: Multiple Graphs in One Report Window
Now you can work with the window by sending messages to the reference csp. This is a display box reference, whose capabilities are similar to those of a Report for a platform. You can use multiple-argument subscripting to locate specific items within the outline tree:
csp["Control ?", "moving range ?"] << Close;
csp["Dist?", "quantiles"] << Close;
Notice that the preceding script not only assigned the whole window to a reference (csp) but also assigned the platform launch scripts to names (cc and dist) within their display boxes. This makes it easy to route messages to the platforms. You could, in turn, get the reports for these and have yet another way to manipulate display boxes. The following are equivalent messages that reopen the nodes:
rcc = cc << Report;rdist = dist << Report;rcc["moving range ?"] << Close;
rdist["quantiles"] << Close;
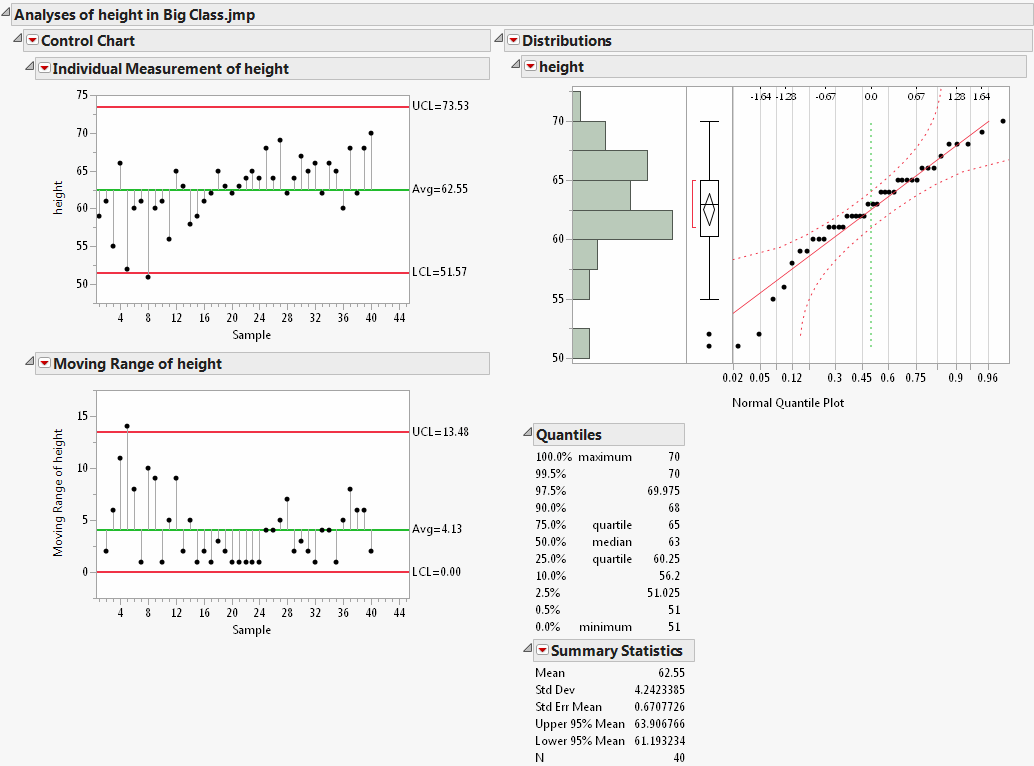
You can send messages directly to the platform references themselves. Find out your options by searching for “Distribution” and “Control Chart” in the JMP Scripting Index. For example, Control Chart provides a message called Needle that creates a needle chart. Distribution provides a message called Normal Quantile Plot.
To execute these options from JSL, send them as messages to the platform references:
cc << Needle;dist << Normal Quantile Plot;Figure 11.26 Changing a Custom Report

