Example of Conditional Association and Relative Risk
This example uses the AdverseR.jmp sample data table, which contains adverse reactions from a clinical trial. Use this data to explore the conditional association of adverse events and then the relative risk of the events in the treatment group as compared to the control.
1. Select Help > Sample Data Library and open AdverseR.jmp.
2. Select Analyze > Consumer Research > Categorical.
3. Select the Multiple tab.
4. Select ADVERSE REACTION and click Multiple Response by ID on the Multiple tab.
5. Select TREATMENT GROUP and click X, Grouping Category.
6. Select PATIENT ID and click ID.
7. Under the other launch window options, select Unique Occurrences within ID and click OK.
8. Click the Categorical red triangle and select Conditional Association.
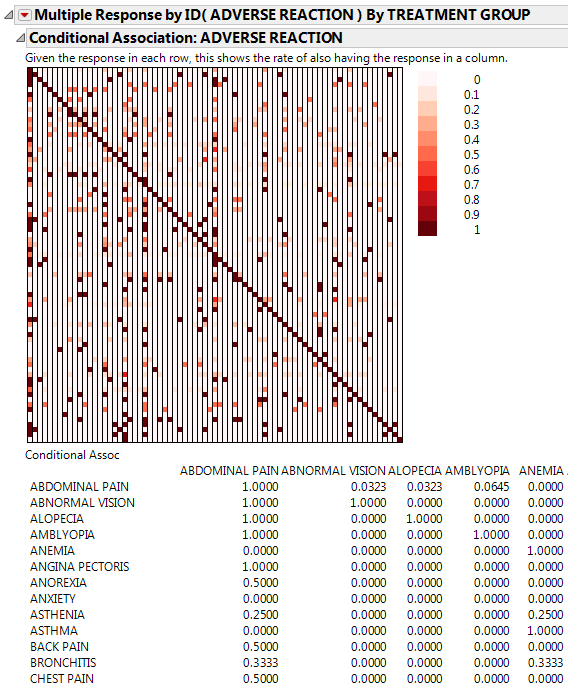
Figure 3.31 Conditional Association Report (Partial Report)
The conditional association matrix provides the conditional probability of one adverse reaction given the presence of another reaction. The probabilities are across all groups. The probability of abnormal vision given that a patient has abdominal pain is 0.0323.
Tip: Hover over the heat map for conditional probabilities.
9. Click the Categorical red triangle and select Relative Risk.
10. Select PBO in the window and click OK.
Right-click the Relative Risk Report in the window and select Sort by Column.
11. Select Relative Risk and click OK.
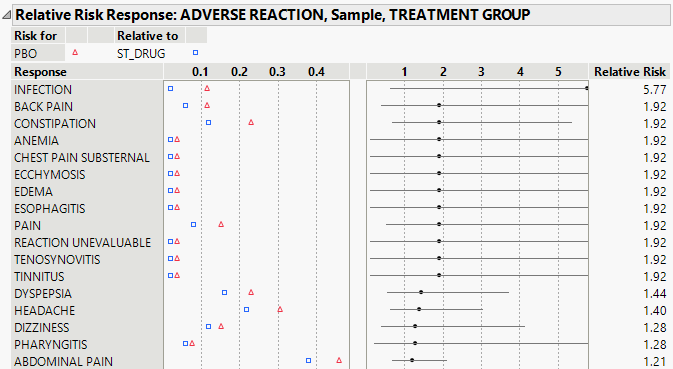
Figure 3.32 Relative Risk Report (Partial Report)
The Relative Risk option computes relative risks of different responses as the ratio of the risk for each level of the grouping variable. The default Relative Risk report lists the response name, the risk (rate) for each level of the grouping variable, a plot of the relative risk with 95% confidence intervals, and the relative risk estimate. Here you can compare the relative risk of the adverse reactions by treatment group. The relative risk of an infection is 5.7 times greater for PBO relative to ST_DRUG. However, the confidence interval is very wide and includes a relative risk of 1.0. A relative risk of 1.0 occurs when the risk is equal for each level of the grouping variable.
Right-click and select Columns > Lower 95% and Columns > Upper 95% to add 95% confidence intervals on the relative risk estimates to the report table.

