Operating Characteristic Curves Utility
The Operating Characteristic (OC) Curves utility enables you to construct OC curves for control charts and attribute acceptance sampling plans. OC curves are available for XBar, P, NP, C, and U charts. For specified control charts, the OC curve shows the probability of failing to detect a shift of a particular size. In addition, there are OC curves for single and double attribute acceptance sampling plans. For a specified acceptance sampling plan, the OC curve shows how the probability of accepting a lot changes with the lot quality.
Note: The OC curves for control charts are two-sided curves. They are drawn for negative and positive shifts. Often OC curves display one curve for the absolute shift.
Launch the OC Curves Utility
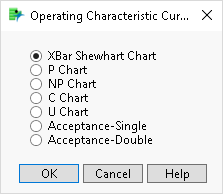
Launch the Operating Characteristic Curves by selecting Analyze > Quality and Process > OC Curves. Select the OC curve of interest and click OK to launch.
Figure 15.4 OC Curves Launch Window
