Publication date: 09/28/2021
Run Chart Example
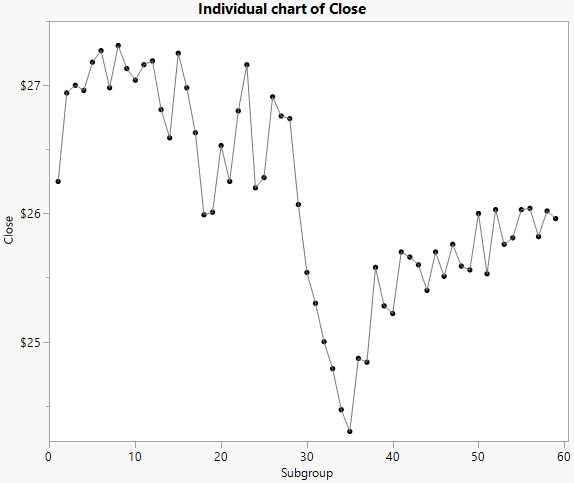
Runs charts display a column of data as a connected series of points. This example is a Runs chart for the Close variable from Stock Averages.jmp in the Quality Control sample data folder.
1. Select Help > Sample Data Library and open Stock Averages.jmp.
2. Select Analyze > Quality and Process > Control Chart > Run Chart.
3. Select Close and click Y.
4. Click OK.
Figure 3.22 Run Chart for Stock Averages Closing Price
Want more information? Have questions? Get answers in the JMP User Community (community.jmp.com).
