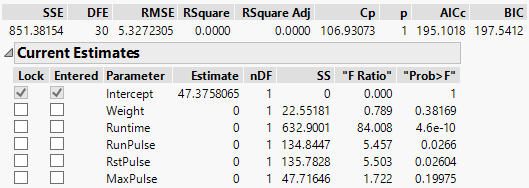
Current Estimates Report
Use the Current Estimates report to enter, remove, and lock in model effects. (The intercept is permanently locked into the model.) This report contains the following columns:
Figure 5.8 Current Estimates Table
Lock
Locks a term in or out of the model. A checked term cannot be entered or removed from the model.
Entered
Indicates whether a term is currently in the model. You can click a term’s check box to manually bring an effect in or out of the model.
Parameter
The effect names.
Estimate
The current parameter estimate, which is zero if the effect is not currently in the model.
nDF
The number of degrees of freedom for a term. A term has more than one degree of freedom if its entry into a model also forces other terms into the model.
Wald/Score ChiSq
(Shown only when response is categorical.) The test statistic for each term in the model. For terms not already included in the model, the test statistic is based on a score test of including the term in the model. For terms that are already included in the model, the test statistic is based on a Wald test of removing the term from the model.
“Sig Prob”
(Shown only when response is categorical.) The p-value associated with the Wald/Score ChiSq test statistic based on nDF degrees of freedom. The “Sig Prob” is used to determine the next term to be included in the model.
SS
(Shown only when response is continuous.) The reduction in the error (residual) sum of squares (SS) if the term is entered into the model or the increase in the error SS if the term is removed from the model. If a term is restricted in some fashion, it could have a reported SS of zero.
“F Ratio”
(Shown only when response is continuous.) The traditional test statistic to test that the term effect is zero. It is the square of a t-ratio. It is in quotation marks because it does not have an F-distribution for testing the term because the model was selected as it was fit.
“Prob>F”
(Shown only when response is continuous.) The p-value associated with the F statistic. Like the “F Ratio,” it is in quotation marks because it is not to be trusted as a real significance probability.
R
The multiple correlation with the other effects in the model. This column appears only if you right-click in the report and select Columns > R.
