 Example of Model Screening for Continuous Response
You have baseline medical data for 442 diabetic patients. You also have a continuous measure of diabetes disease progression obtained one year after each patient’s initial visit. Higher values correspond to more disease progression. You want to assess various models for their ability to predict diabetes disease progression.
1. Select Help > Sample Data Library and open Diabetes.jmp.
2. Select Analyze > Predictive Modeling > Model Screening.
3. Select Y and click Y, Response.
4. Select Age through Glucose and click X, Factor.
5. In the Folded Crossvalidation section, select the box next to K Fold Crossvalidation.
6. (Optional) In the Options section, type 42920 next to Set Random Seed.
Use the random seed in order to match the example output.
7. Click OK.
8. Click the red triangle next to Model Screening for Y and select Optional Reports > Elapsed Time.
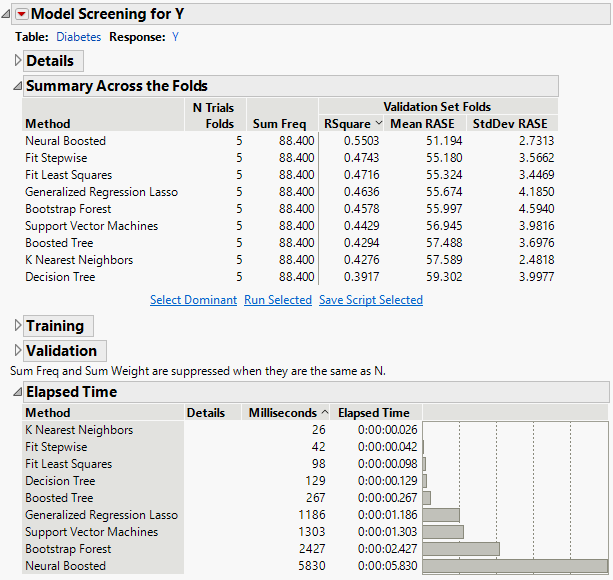
Figure 10.2 Model Report for Continuous Response
The best performing model based on the Validation RSquare averaged across the folds, is Neural Boosted. The average Validation RSquare for Neural Boosted is 0.5503. The Elapsed Time report shows that the Neural Boosted models also took the longest to fit. In this case, the elapsed time was only 5 seconds, but this information could be important for larger data sets or more complex models.
Tip: To see performance metrics for the individual models, click the gray disclosure icon next to Validation.
