Illustration of Dendrogram and Distance Graph
Consider the dendrogram report for Birth Death Subset.jmp in Example of Clustering.
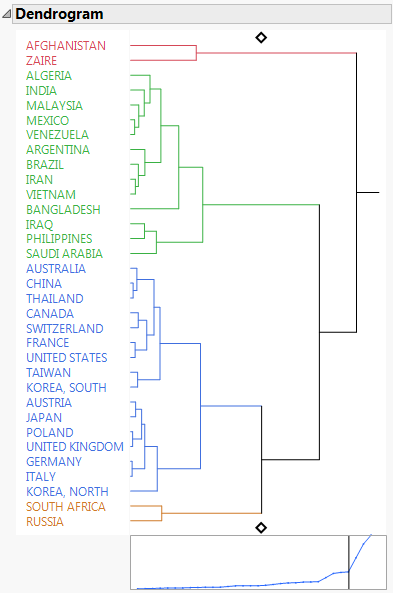
Figure 12.5 Dendrogram Report for Birth Death Subset.jmp
The diamonds are set at four clusters. The two clusters that are most recently joined to form the four cluster model are the cluster consisting of Algeria to Bangladesh and the cluster consisting of Iraq to Saudi Arabia. The distance between these two clusters is the point on the distance plot indicated by the vertical line when the diamond is set to 4. The distance is given in the Clustering History report next to Number of Clusters equal to 4. There, it is shown that the distance is 1.618708760 and that clusters beginning with Algeria and Iraq are combined to yield four clusters.
The two clusters that are combined to yield five clusters are the cluster that consists of Australia to Korea, South, and the cluster that consists of Austria to Korea, North. The vertical join line in the dendrogram for these clusters is at about the same horizontal distance from the left as the vertical join line for the clusters that were joined to form the four-cluster model, Algeria to Bangladesh and Iraq to Saudi Arabia. It follows that there is not much difference in terms of distance between the clusters joined to form the four-cluster model and those joined to form the five-cluster model.
The fact that the distance plot levels off starting with the four-cluster model indicates that the cluster groupings up to that point do not account for much distance between clusters. However, the four-cluster model shows good separation between clusters.
