Example of a Structured Report
This example uses the Consumer Preferences.jmp sample data table to compare job satisfaction and salary against gender by age group and position tenure. Use the Structured tab to create the report.
1. Select Help > Sample Data Library and open Consumer Preferences.jmp.
2. Select Analyze > Consumer Research > Categorical.
3. Select the Structured tab.
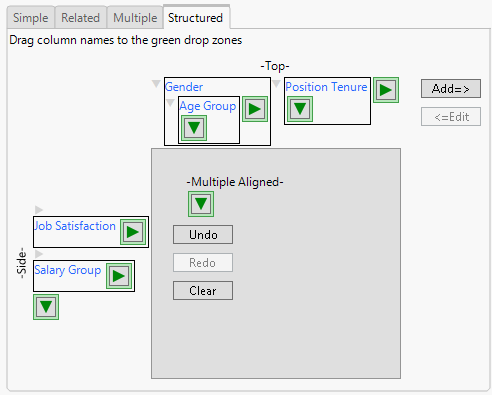
4. Drag Gender to the green drop zone at the Top of the table on the Structured tab.
5. Drag Age Group to the green drop zone just below Gender.
6. Drag Position Tenure to the green drop zone at the Top of the table next to Gender.
7. Drag Job Satisfaction to the green drop zone at the Side of the table.
8. Drag Salary Group to the green drop zone at the Side of the table under Job Satisfaction.
Tip: Click on the green drop zone arrows to select columns.
Figure 3.42 Structured Tab Report Setup
9. Click Add=>.
10. Click OK.
11. Click the Categorical red triangle and select Test Response Homogeneity.
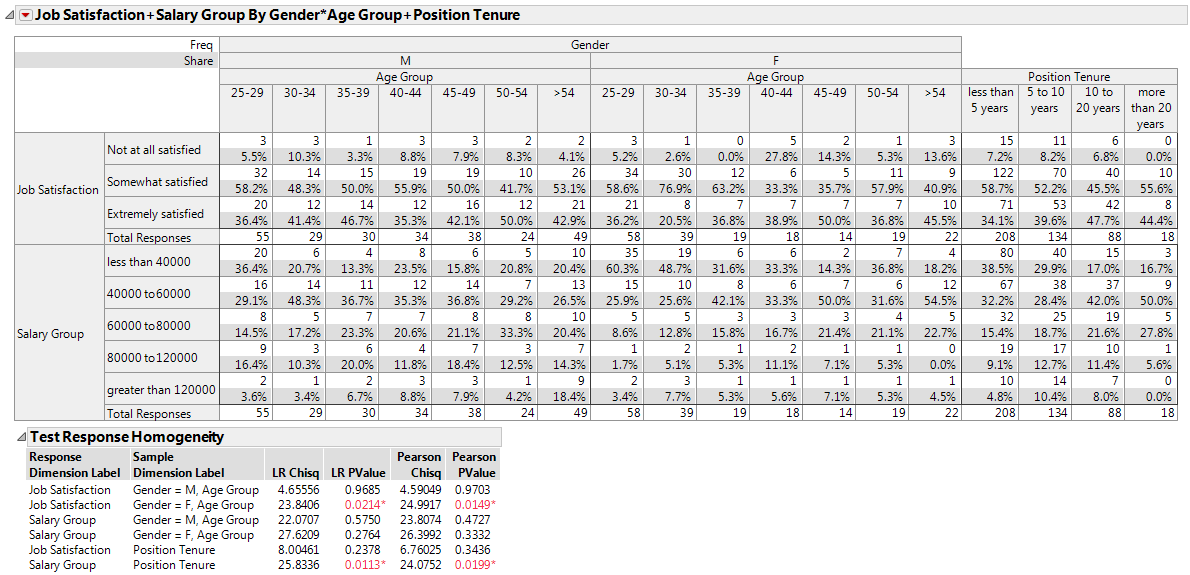
Figure 3.43 Structured Tab Report Example
The structured tab report contains the table that you specified in the Structured tab. The tests for response homogeneity are for each combination of grouping variables. We see that, for males, there is no difference in job satisfaction across age groups (Pearson p-value = 0.9703). For females, there is a difference in job satisfaction across age groups (Pearson p-value = 0.0149). The middle-aged females tend to be the least satisfied with their jobs. Share and frequency charts can be added to your report to visualize your results.

