Example of the Nonparametric Wilcoxon Test
Use a Wilcoxon test to determine if the mean profit earned by companies differs by type of company. In Companies.jmp, the data consist of various metrics on two types of companies, Pharmaceutical (12 companies) and Computer (20 companies).
1. Select Help > Sample Data Library and open Companies.jmp.
2. Select Analyze > Fit Y by X.
3. Select Profits ($M) and click Y, Response.
4. Select Type and click X, Factor.
5. Click OK.
6. Click the red triangle next to Oneway Analysis of Profits ($M) By Type and select Display Options > Box Plots.
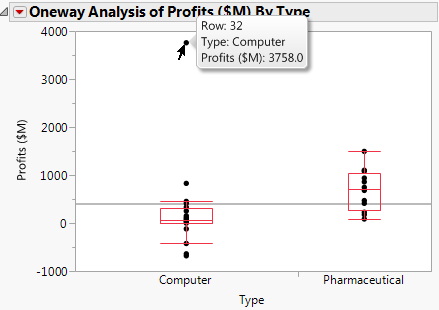
Figure 6.24 Computer Company Profit Distribution
The box plots suggest that the distributions are not normal or even symmetric. There is a very large value for the company in row 32 that might affect parametric tests.
7. Click the red triangle next to Oneway Analysis of Profits ($M) By Type and select Means/ANOVA/Pooled t.
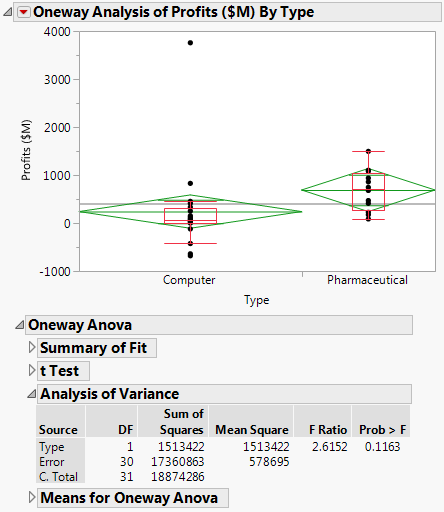
Figure 6.25 Company Analysis of Variance
The F test shows no significance because the p-value is large (p = 0.1163). This might be due to the large value in row 32 and the possible violation of the normality assumption.
8. Click the red triangle next to Oneway Analysis of Profits ($M) By Type and select t Test.
Figure 6.26 t Test Results
The Prob > |t| for a two-sided test is 0.0671. The t test does not assume equal variances, but the unequal variances t test is also a parametric test.
9. Click the red triangle next to Oneway Analysis of Profits ($M) By Type and select Nonparametric > Wilcoxon Test.
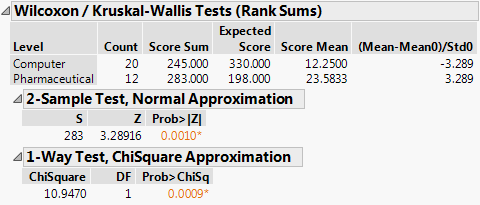
Figure 6.27 Wilcoxon Test Results
The Wilcoxon test is a nonparametric test. It is based on ranks, so it is resistant to outliers. Also, it does not require normality.
Both the normal and the chi-square approximations for the Wilcoxon test statistic indicate significance at a p-value of 0.0010. You conclude that there is a significant difference in the location of the distributions, and conclude that mean profit differs based on company type.
The normal and chi-square tests are based on the asymptotic distributions of the test statistics. If you have JMP Pro, you can conduct an exact test.
10.  Click the red triangle next to Oneway Analysis of Profits ($M) By Type and select Nonparametric > Exact Test > Wilcoxon Exact Test.
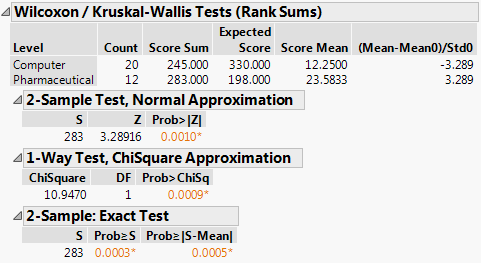
Figure 6.28 Wilcoxon Exact Test Results
The observed value of the test statistic is S = 283. This is the sum of the ranks for the level of Type with the smaller sample size (pharmaceuticals). The probability of observing an absolute difference from the mean midrank that exceeds the absolute value of S minus the mean of the midranks is 0.0005. This is a two-sided test for a difference in location and supports rejecting the hypothesis that profits do not differ by type of company.
In this example, the nonparametric tests are more appropriate than the normality-based ANOVA test and the unequal variances t test. The nonparametric tests are resistant to the large value in row 32 and do not require the assumption of normality.


