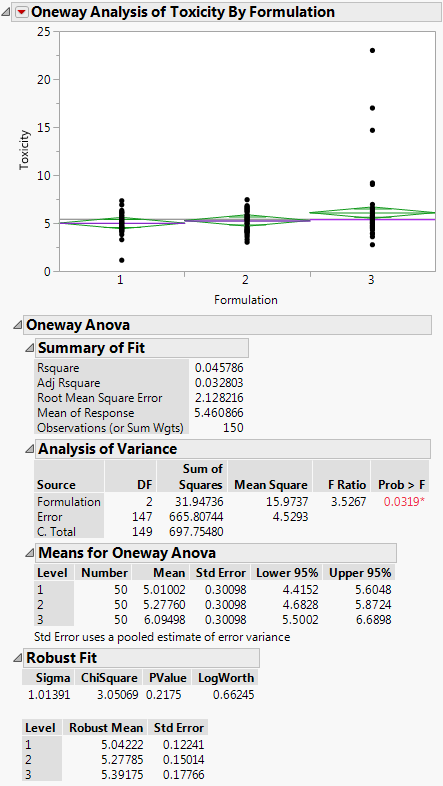
Example of the Robust Fit Option
Use a Robust fit in this example where one of three groups contains outliers. The data in the Drug Toxicity.jmp sample data table shows the toxicity levels for three different formulations of a drug.
1. Select Help > Sample Data Library and open Drug Toxicity.jmp.
2. Select Analyze > Fit Y by X.
3. Select Toxicity and click Y, Response.
4. Select Formulation and click X, Factor.
5. Click OK.
6. Click the red triangle next to Oneway Analysis of Toxicity By Formulation and select Means/Anova.
7. Click the red triangle next to Oneway Analysis of Toxicity By Formulation and select Robust > Robust Fit.
Figure 6.31 Example of Robust Fit
If you look at the standard Analysis of Variance report, you might wrongly conclude that there is a difference between the three formulations, since the p-value is 0.0319. However, when you look at the Robust Fit report, you would not conclude that the three formulations are significantly different, because the p-value there is 0.2175. It appears that the toxicity for a few of the observations is unusually high, creating the undue influence on the data.
