Example of the Tabulate Platform
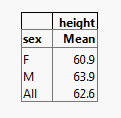
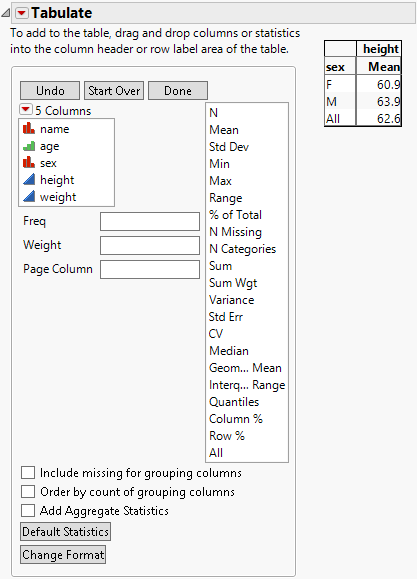
Learn how to summarize data in a tabular format using the Tabulate platform. In this example, you have data containing height measurements for male and female students. You want to create a table that shows the mean height for males and females and the aggregate mean for both sexes.
Figure 9.2 Table Showing Mean Height
1. Select Help > Sample Data Library and open Big Class.jmp.
2. Select Analyze > Tabulate.
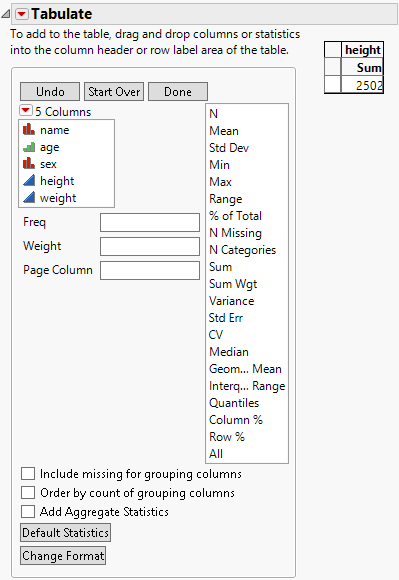
Since height is the variable that you are examining, you want it to appear at the top of the table.
3. Click height and drag it into the Drop zone for columns.
Figure 9.3 Height Variable Added
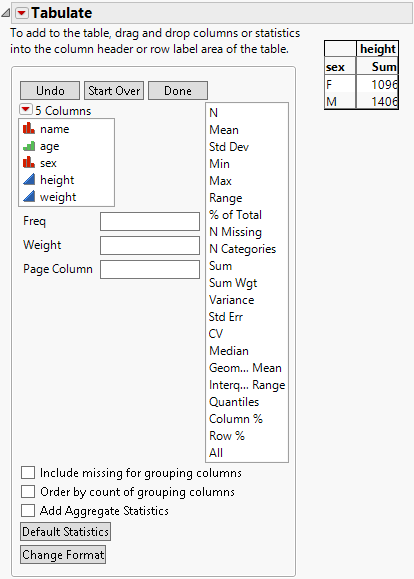
You want the statistics by sex, and you want sex to appear on the side.
4. Click sex and drag it into the blank cell next to the number 2502.
Figure 9.4 Sex Variable Added
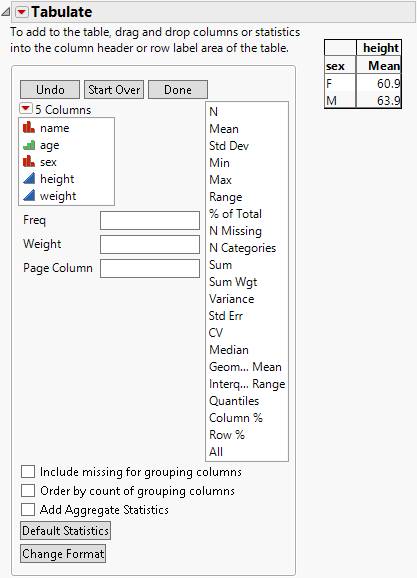
Instead of the sum, you want it to show the mean.
5. Click Mean and drag it on top of Sum.
Figure 9.5 Mean Statistic Added
You also want to see the combined mean for males and females.
6. Click All and drag it on top of sex. Or, you can simply select the Add Aggregate Statistics check box.
Figure 9.6 All Statistic Added
7. (Optional) Click Done.
The completed table shows the mean height for females, males, and the combined mean height for both.
