Additional Example of the Marker Statistics Platform
Learn how to calculate linkage statistics from your genetic data.
1. Select Help > Sample Data Folder > Life Sciences and open Genotypes Pedigree.jmp.
2. Select Analyze > Genetics > Marker Statistics.
3. Open the Markers column, select the first ten marker columns, and click Marker.
4. Select the same ten markers and click With Marker.
5. Click OK.

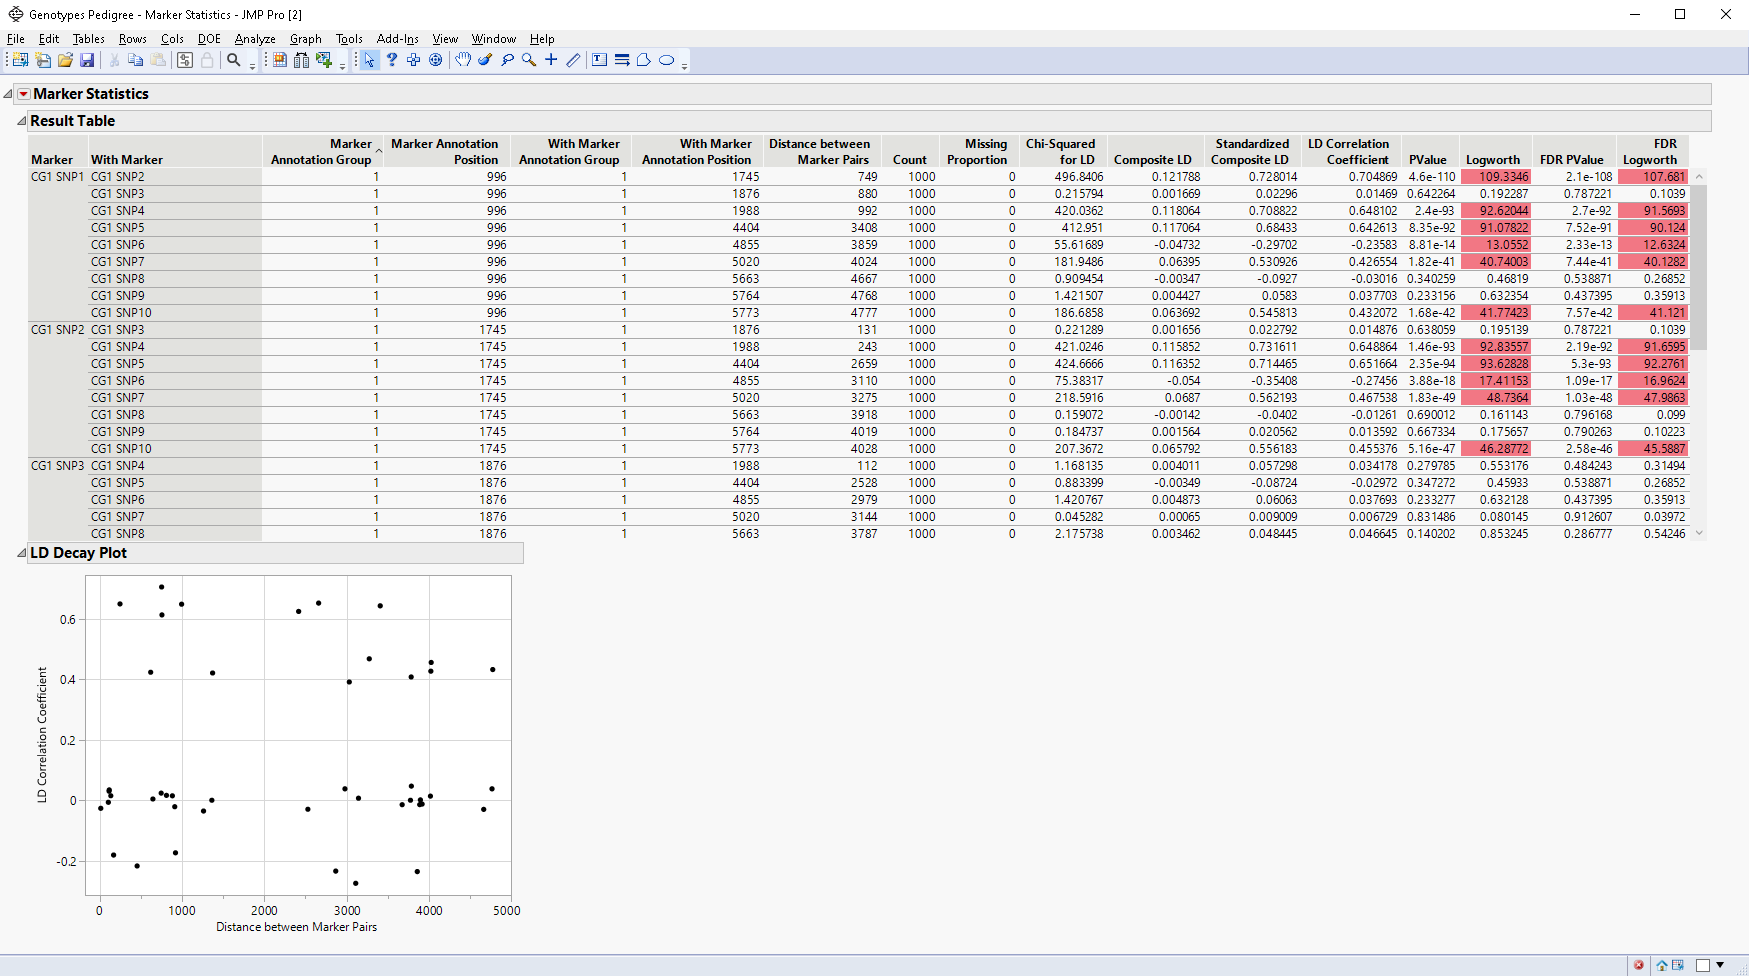
The values shown for each pair of markers are indicative of the strength of linkage disequilibrium between the pair.
The LD Decay plot shows the relationship between LD Correlation Coefficient on the y-axis and the distance between marker pairs on the x-axis in order to understand the pattern of linkage disequilibrium (LD). Linkage disequilibrium generally declines exponentially as the distance between the markers increases.