Additional Example of the Repeated Measures Degradation Platform
Use the Repeated Measures Degradation platform to fit an accelerated repeated measures degradation model to the decrease in power for a set of devices. The devices were assigned to one of three temperature settings to accelerate the power degradation. You are interested in estimating the proportion of devices that will fail after 15 years (approximately 130,000 hours) at the usual operating temperature of 80 degrees Celsius. This example is patterned after an example in Meeker et al. (2022, ch. 21).
1. Select Help > Sample Data Folder and open Reliability/Device B.jmp.
2. Select Analyze > Reliability and Survival > Repeated Measures Degradation.
3. Select Power Drop and click Y, Response.
4. Select Hours and click Time.
5. Select Degrees C and click X.
The temperature setting is the accelerating factor in the experiment.
6. Select Device and click Label, System ID.
7. In the entry field for Lower Failure Definition, enter -0.5.
8. In the entry field for Use Condition, enter 80.
The usual operating temperature is 80 degrees Celsius.
9. Click OK.
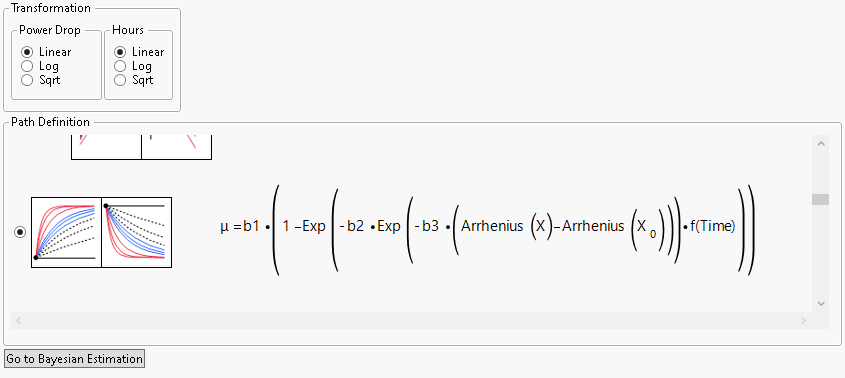
10. In the Path Definition panel, select the seventh model.
Figure 8.12 Selected Path Definition Model
11. Select Celsius as the temperature unit.
12. Click OK.
13. Keep 195 as the reference temperature, since 195 is the middle of the three test temperatures.
14. Click OK.
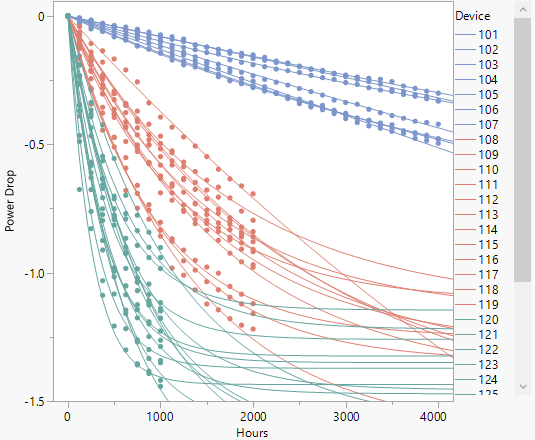
The curves in the plot update to match the selected model.
Figure 8.13 Initial Model Specification

Figure 8.14 Initial Model Plot
15. Click Go to Bayesian Estimation.
16. Click Fit Model.
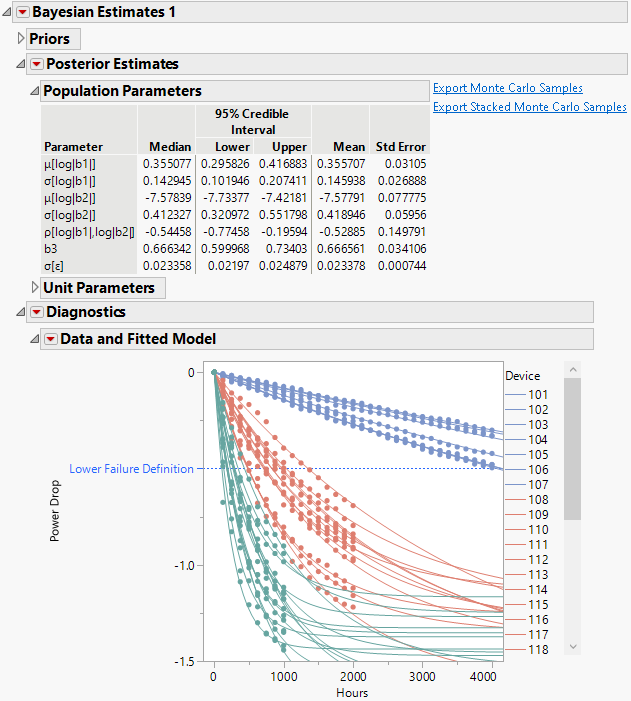
Figure 8.15 Posterior Estimates and Diagnostics
The Posterior Estimates report shows the results of the MCMC procedure. Use the buttons to the right of the table to view all the MCMC samples in a data table. The Diagnostics report shows the original data values along with curves for the fitted model.
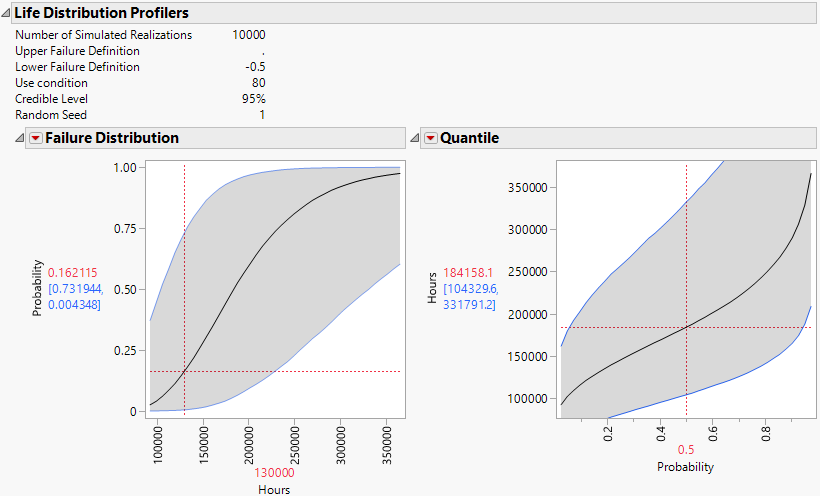
17. In the Failure Distribution profiler, type 130000 for Hours.
Figure 8.16 Life Distribution Profilers
The Failure Distribution profiler shows that at a use condition of 80 degrees Celsius, the estimated failure rate at 130,000 hours is approximately 0.16 with a 95% credible interval of 0.004 to 0.732.


