Publication date: 06/21/2023
Contour Plots
View Multidimensional Relationships in Two Dimensions
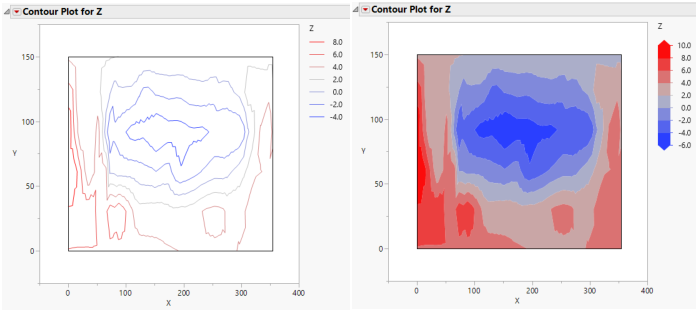
The Contour Plot command in the Graph menu constructs contours of a response in a rectangular coordinate system. A contour plot shows a three-dimensional surface in two dimensions. Contours delineate changes in the third dimension.
Here are some of the options available with the Contour platform:
• specify the number of contour levels
• choose to plot contour lines or filled contours
• show or hide data points
• label contours with response values
• define and use a custom coloring scheme
Figure 10.1 Examples of Contour Plots
Contents
Example of a Contour Plot
Example Using the Contour Platform
Example of a Contour Plot in Graph Builder
Launch the Contour Plot Platform
Contour Plot in JMP
Contour Plot Platform Options
Fill Areas in Contour Plots
Customize a Contour Plot
Contour Plot Save Options
Use Formulas to Specify Contours
Additional Example of Contour Plots
Want more information? Have questions? Get answers in the JMP User Community (community.jmp.com).
