Example of Axis Scale Changes in the Compare Distributions Plot
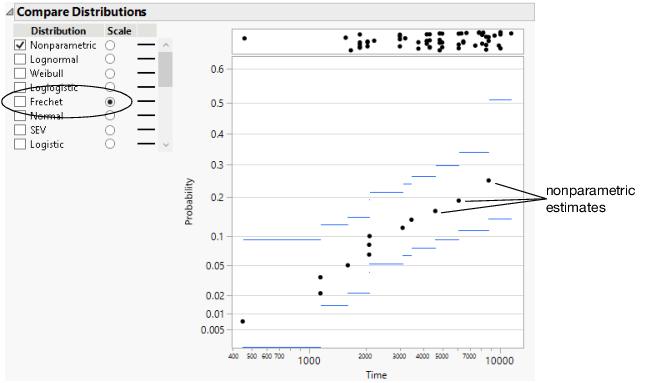
Using different scales to plot failure time distributions is sometimes referred to as drawing the distributions on different types of probability paper. In the initial Compare Distributions report, the probability and time axes are linear. This example shows you how to view the distribution estimates on a Fréchet scale.
1. Follow step 1 through step 5 in Example of the Life Distribution Platform.
2. In the Compare Distributions report, select Fréchet in the Scale column.
3. Click the Life Distribution red triangle and select Interval Type > Pointwise.
Figure 3.14 Nonparametric Estimates with a Fréchet Probability Scale
Using a Fréchet scale, the nonparametric estimates approximate a straight line, meaning that a Fréchet fit might be reasonable.
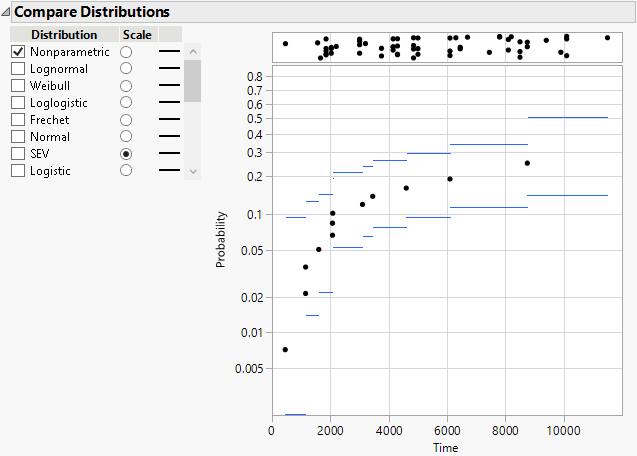
4. Select SEV in the Scale column.
The nonparametric estimates no longer approximate a straight line. You now know that the SEV distribution is not appropriate.
Figure 3.15 Nonparametric Estimates with a SEV Probability Scale

