Example of Item Analysis
In this example, you use the Item Analysis platform to understand the relationship between test questions and subject abilities. This example uses scores (1 = correct or 0 = incorrect) for 1263 students on 14 questions. The questions on the test are the items that are used to measure the latent mathematical ability. You examine the first four questions with a 2PL model to understand the relationship between questions and respondent’s mathematical ability.
1. Select Help > Sample Data Folder and open MathScienceTest.jmp.
2. Select Analyze > Multivariate Methods > Item Analysis.
3. Select Q1 through Q4, click Y, Test Items and click OK.
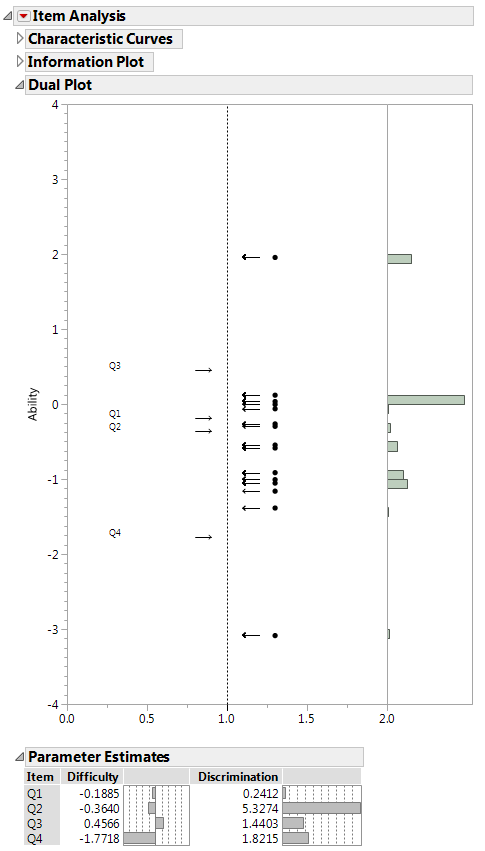
Figure 12.2 Item Response Report
From the dual plot you note that Q4 is the easiest of the four questions to answer as it has the lowest difficulty score at -1.78. Q3 is the hardest with a difficulty score of 0.46. Most of the respondents fall in the middle to lower end of the ability scale as shown by the data points in the center part of the graph. In the histogram, you can see that approximately 40% of the respondents fall slightly above zero on the ability scale.
Note: Ability scores are not computed for individuals with all incorrect or all correct answers. See Statistical Details for Fitting the IRT Model.
4. Click the gray Characteristic Curves report disclosure icon to open.
5. Click the Item Analysis red triangle and select Number of Plots Across.
6. Enter 2 and click OK.
7. Click the gray Information Plot report disclosure icon to open.
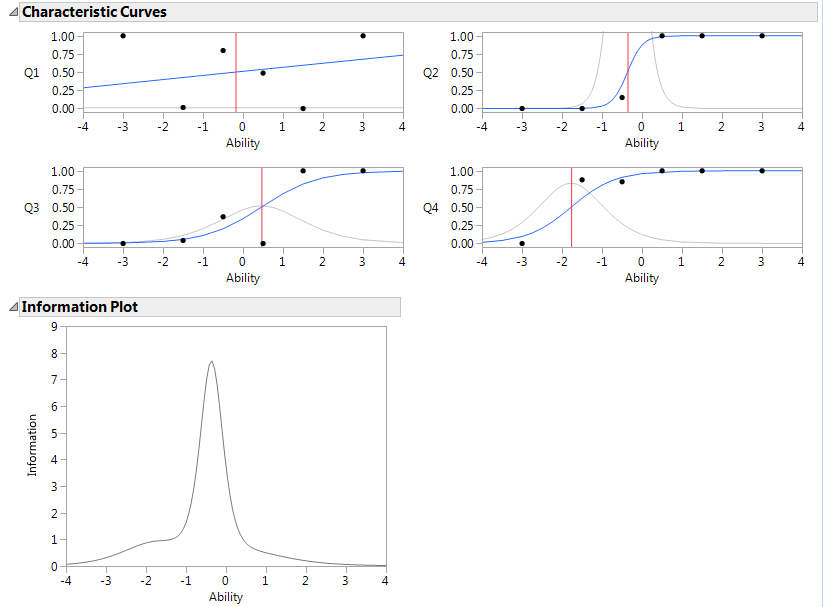
Figure 12.3 Item Response Example
Q1 has a flat characteristic curve and a flat information curve. This suggests that Q1 does not provide much information to discriminate respondents’ mathematical ability. The characteristic curve for Q2 is steep, which indicates that Q2 is useful for discriminating respondent ability. The vertical line in each plot is at the inflection point for the characteristic curve. This vertical line is the ability level at which the respondent has a 50% probability of answering the specified question correctly.
The information plot indicates that together the four questions analyzed provide the most information about ability levels between about -1 and 0. Including more questions of higher difficulty in the model could broaden the information curve.

