Example of Principal Component Analysis
In this example, you perform a principal components analysis on six factors.
1. Select Help > Sample Data Folder and open Solubility.jmp.
2. Select Analyze > Multivariate Methods > Principal Components.
3. Select all of the continuous columns and click Y, Columns.
4. Select Narrow Data next to Method Family, since you are only analyzing six factors.
5. Keep the default Variance Estimation and then click OK.
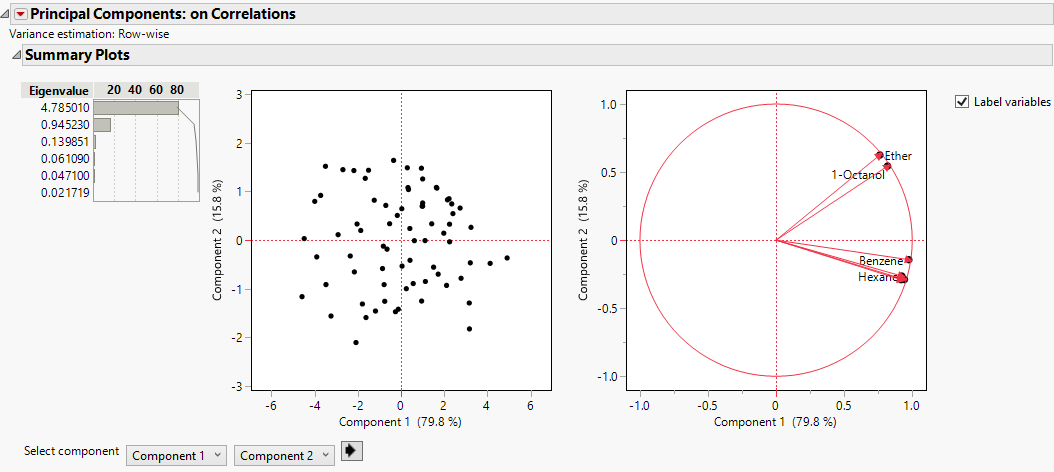
Figure 4.2 Principal Components on Correlations Report
The report gives the eigenvalues and a bar chart of the percent of the variation accounted for by each principal component. In this example, the first principal component accounts for almost 80% of the variation in the data. Together, the first two principal components account for almost all of the variation in the data (95.5%). There is a Score Plot and a Loadings Plot as well. See Principal Components Report.
