Example of Wafer Defect Classification Using Spatial Measures
In this example, you use a specialty clustering option called Spatial Measures that is available in the Hierarchical Cluster platform.
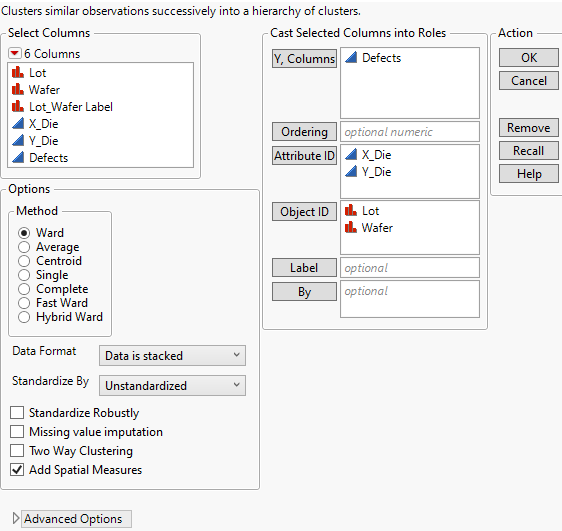
1. Select Help > Sample Data Folder and open Wafer Stacked.jmp.
2. Select Analyze > Clustering > Hierarchical Cluster.
3. In the list next to Data Format, select Data is stacked.
Additional options for stacked data appear in the launch window.
4. Select Defects and click Y, Columns.
5. Select X_Die and Y_Die and click Attribute ID.
6. Select Lot and Wafer and click Object ID.
7. Select Add Spatial Measures.
Figure 13.7 Completed Clustering Launch Window
8. Click OK.
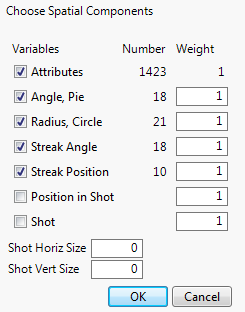
Figure 13.8 Spatial Components Window
Because Defects is measured at 1423 locations, there are 1423 Attributes variables.
9. Click OK to accept the selections in the Spatial window.
Two windows open: the Hierarchical Clustering report and the Wafer Stacked Defects Spatial data table.
10. In the Dendrogram plot, click and drag the diamond-shaped handle at the top to explore various numbers of clusters.
As you drag the handle, the vertical line in the distance graph below the dendrogram moves to the corresponding number of clusters. The vertical coordinate gives the distance between the clusters that were joined at the given step. The graph seems to level off when the number of clusters is 7.
11. Click the Hierarchical Clustering red triangle and select Number of Clusters.
12. Enter 7 and click OK.
13. Click the Hierarchical Clustering red triangle and select Cluster Summary.
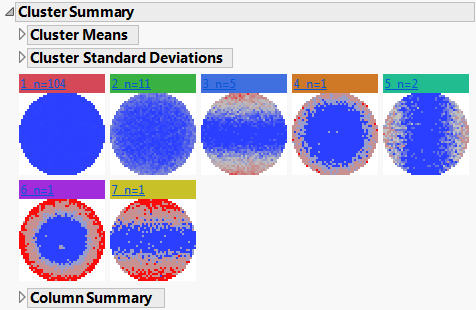
Figure 13.9 Cluster Summary Report
The wafer maps indicate the spatial nature of defects for each cluster. Cluster 1 contains 104 wafers with relatively few defects that are spread throughout the wafers. Cluster 3 has 5 wafers with defects concentrated at the extremes of the top and bottom hemispheres. You can view the maps for individual wafers and their Hough space maps in the data table produced by the cluster analysis. See Statistical Details for Spatial Measures.


