Statistical Details for Dissolution Curve Analysis
This section contains the formulas to calculate the factors that are used in model-free dissolution analyses in the Fit Curve platform. The formulas use the following notation:
μRi is the mean of the dissolution values for the batch of reference curves at time point ti
μTi is the mean of the dissolution values for the batch of test curves at time point ti
i = 1, ..., N is the number of time points
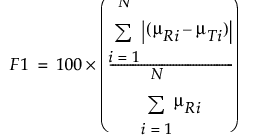
F1 Difference Factor
The F1 difference factor measures the percent difference between the curves of the reference tablet and the curves of the test tablet at each time point. F1 is calculated using the following formula:

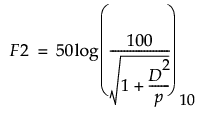
F2 Similarity Factor
The F2 similarity factor measures the similarity of percent dissolution between the curves of the reference tablet and the curves of the test tablet. F2 is calculated using the following formula (Paixão et al. 2017):

where:

p is the number of time points
Mahalanobis Distance
The Mahalanobis distance M, measures the multivariate distance between the curves of the reference tablet and the curves of the test tablet. M is calculated using the following formula (Paixão et al. 2017):

where:
R = [μR1,...,μRN]T
T = [μT1,...,μTN]T
Spooled = (SR + ST)/2
SR = covariance matrix of the reference curve values
ST = covariance matrix of the test curve values
The 10% maximum difference is calculated using the following formula:

where m is an Nx1 vector of 10’s.