Example of a Nested Measurement Systems Analysis
Examine the Data
1. Select Help > Sample Data Folder and open Variability Data/2 Factors Nested.jmp.
2. Select Analyze > Distribution.
3. Select Operator and Part and click Y, Columns.
4. Click OK.
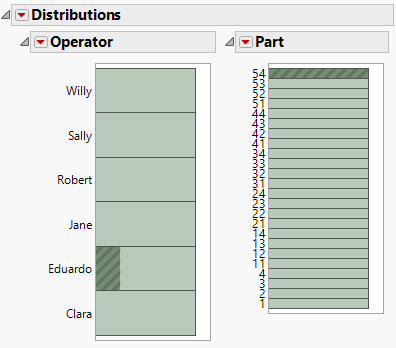
Figure 4.8 Distribution of Operator and Part
If you click various bars in the histograms, you can see that each level of Part is only associated with one of the operators. This is how you can tell that Part is nested within Operator.
Perform the Analysis
1. Select Analyze > Quality and Process > Measurement Systems Analysis.
2. Select Y and click Y, Response.
3. Select Part and click Part, Sample ID.
4. Select Operator and click X, Grouping.
5. In the Chart Dispersion Type section, select Range.
6. In the Model Type section, select Nested.
7. Click OK.
8. Click the red triangle next to Measurement Systems Analysis for Y and select AIAG Gauge R&R Results.
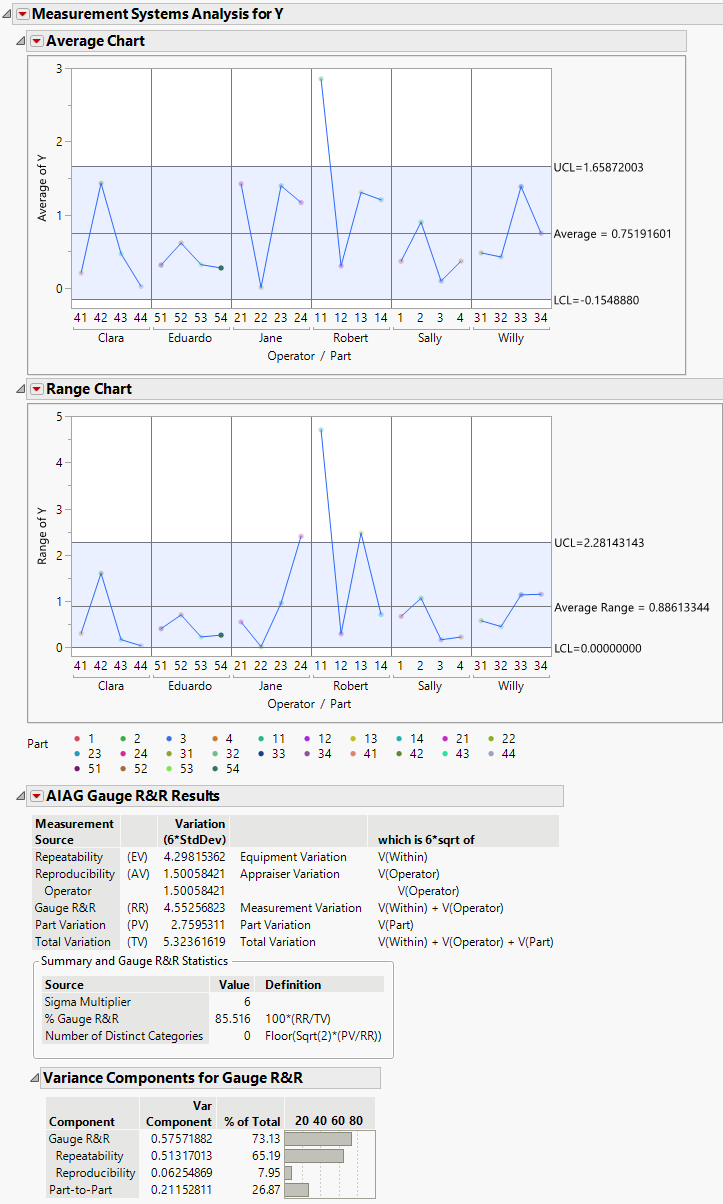
Figure 4.9 Gauge R&R Results for Nested Analysis
The portion of variation that comes from the measurement is quite high. In the Summary and Gauge R&R Statistics report, the % Gauge R&R is 85.516%. Since an acceptable measurement system typically has a % Gauge R&R of less than 30%, this measurement system can be classified as unacceptable.
9. (Optional) Click the red triangle next to Average Chart and select Show Data to add the observations to the Average Chart. This helps to visualize the variability within part measurements that this analysis is highlighting.

