Example of the Model Comparison Table in Generalized Regression
This example develops multiple prediction models for a count response that has six predictors. The count response is modeled using a Poisson distribution. The four prediction models are the Lasso, the Elastic Net, the Adaptive Lasso, and the Adaptive Elastic Net. Use the Model Comparison report in Generalized Regression to compare the four prediction models with each other, as well as with the maximum likelihood model, to choose a final model.
1. Select Help > Sample Data Folder and open Liver Cancer.jmp.
2. Select Analyze > Fit Model.
3. Select Node Count from the Select Columns list and click Y.
4. Select BMI through Jaundice and click Macros > Factorial to Degree.
This adds all terms up to degree 2 (the default in the Degree box) to the model.
5. Select Validation from the Select Columns list and click Validation.
6. From the Personality list, select Generalized Regression.
7. From the Distribution list, select Poisson.
8. Click Run.
The Generalized Regression report that appears contains a Model Comparison report, a Model Launch control panel, and a Poisson Maximum Likelihood with Validation Column report. Note that the default estimation method is the Lasso.
Fit the Lasso Model
9. Click Go.
Fit the Elastic Net Model
10. Scroll to the top of the report window and open the Model Launch outline.
11. Select Elastic Net as the Estimation Method.
12. Click Go.
Fit the Adaptive Lasso Model
13. Scroll to the top of the report window and open the Model Launch outline.
14. Select Lasso as the Estimation Method.
15. Select the Adaptive box.
16. Click Go.
Fit the Adaptive Elastic Net Model
17. Scroll to the top of the report window and open the Model Launch outline.
18. Select Elastic Net as the Estimation Method.
Note: Confirm that the Adaptive box is still selected from the previous model.
19. Click Go.
Compare the Models
20. Scroll to the top of the report window.
21. Click the Validation Generalized RSquare column heading in the Model Comparison table.
Figure 7.8 Model Comparison Report
The Model Comparison table is now sorted by the Validation Generalized RSquare values in ascending order. These RSquare values represent how well the models fit the validation set. The negative Validation Generalized RSquare value for the Maximum Likelihood model indicates that this model is over-fitting. The penalized methods all fit the validation data better than the Maximum Likelihood model. While none of the penalized models fit the validation data particularly well, the adaptive methods fit better than the non-adaptive methods. Since the Adaptive Elastic Net model performs best on the validation data, you decide to use it for prediction.
22. Uncheck all the boxes under Show except for the one in the Adaptive Elastic Net row.
23. Click the red triangle next to Poisson Adaptive Elastic Net with Validation Column and select Select Nonzero Terms.
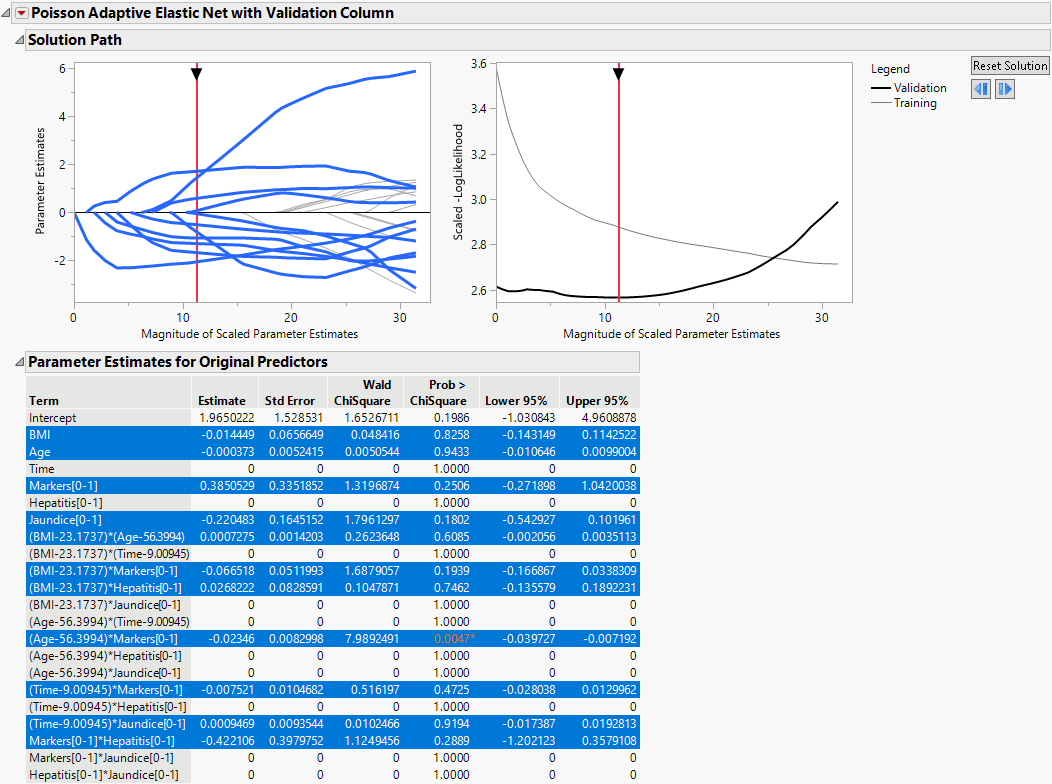
Figure 7.9 Solution Path for Adaptive Elastic Net Fit with Nonzero Terms Highlighted
The nonzero terms in the adaptive elastic net model are selected in the Solution Path and in the Parameter Estimates table.
At this point, you can use this model for prediction or open the Prediction Profiler to further explore the effects of the parameters on the response variable.

