This example uses the Iris.jmp sample data table, which includes measurements of sepal length, sepal width, petal length, and petal width for three species of irises.
|
1.
|
|
2.
|
Select Analyze > Multivariate Methods > Cluster.
|
|
3.
|
|
4.
|
Select K Means on the Options menu.
|
|
5.
|
Uncheck Columns Scaled Individually.
|
|
6.
|
Click OK.
|
|
7.
|
Select Self Organizing Map from the Method menu on the Control Panel.
|
|
8.
|
Even though we know the data consists of three species, set Optional range of clusters equal to 10.
|
|
9.
|
|
10.
|
Click Go.
|
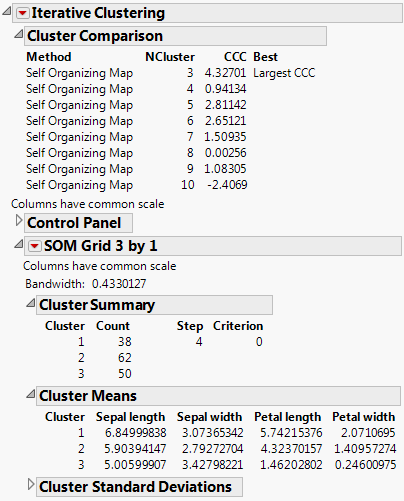
The results are displayed in Self Organizing Map Report Window. Notice the number of clusters that gives the largest CCC is 3, which is the number of species. We can see the classification was not perfect; each cluster should represent each species, with 50 rows for each.
|
11.
|
|
12.
|
Select the Classic option under Markers.
|
|
13.
|
Click Go.
|
|
15.
|
From the SOM Grid 3 by 1 red triangle menu, select Parallel Coord Plots.
|
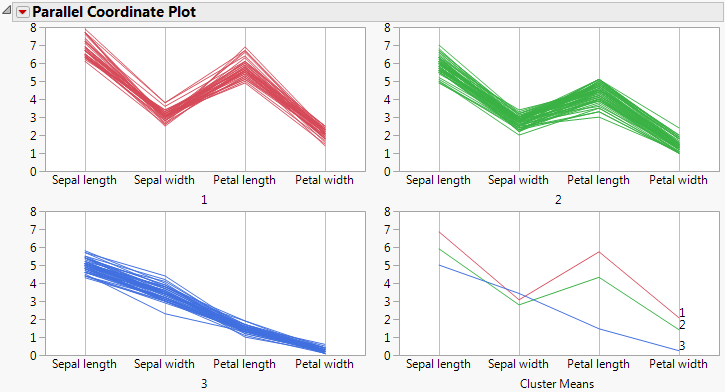
We can see from the Parallel Coordinate Plot in Parallel Coordinate Plot for Iris Data that clusters 1 and 2 (species virginica and versicolor, respectively) can be similar to each other in characteristics. These similarities can make it hard to distinguish between the species. However, the SOM did a relatively good job identifying and classifying these three species.