Wilcoxon Rank Sum Test
What is the Wilcoxon rank sum test?
The Wilcoxon rank sum test, also known as the Mann-Whitney U test, is a nonparametric hypothesis test that compares two independent samples. You would use this test if the normality assumption of your two-samplet-test is not valid. The Wilcoxon rank sum test replaces the data with their ranks, then performs the test.
Practically, the alternative hypothesis is that the population distributions are not identical. Technically, the alternative hypothesis is that one distribution is stochastically dominant over the other. It means that the probability that one variable is bigger than or equal to a value is greater than or equal to the probability that the other variable is bigger than or equal to the value for all values. Mathematically, we can write $P(X_1 \geq x) \geq P(X_2 \geq x)$ for all $x$.
Example of the Wilcoxon rank sum test
Suppose you are interested in knowing if the distribution of particle counts is the same for two furnaces at a deposition operation in semiconductor manufacturing. Two different furnaces are used to deposit a film on a substrate. The number of particles is measured for 10 runs per furnace. The data are shown in the following table.
| DEP1 | DEP2 |
| 8 | 15 |
| 3 | 25 |
| 0 | 111 |
| 0 | 27 |
| 5 | 46 |
| 2 | 3 |
| 0 | 48 |
| 4 | 59 |
| 50 | 201 |
| 0 | 0 |
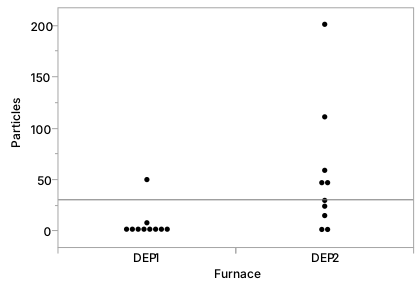
A graph of the data shows particle counts for each furnace.
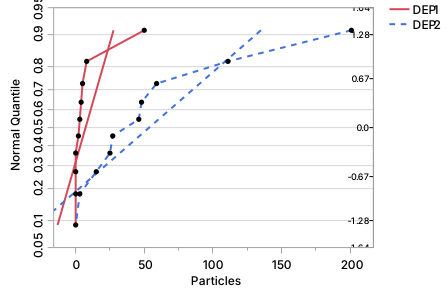
The figure below is a normal quantile plot of the data separated by furnace. It shows the normality assumption does not seem to be valid. This graph shows both furnaces on the same plot. Data from DEP1 are connected with a solid red line. Data from DEP2 are connected with a dotted blue line. The corresponding diagonal line is drawn assuming normality within each group. If the data were normally distributed, we would expect the points for each furnace to be randomly scattered around their lines.
In the figure below, the data for each furnace do not follow the lines. Instead, the points are above the line in the middle of the data and below the line on the left and right (C-shaped pattern). This pattern is consistent with skewed data, which makes sense for particle counts since they have a lower limit at zero.
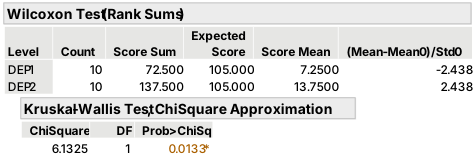
The Wilcoxon rank sum test in the table below shows a significant difference between the two groups, with a p-value of 0.0133. You conclude that the average ranks are different between the two groups.
The Wilcoxon rank sum test is a special case of the Kruskal-Wallis test for more than two groups.