Ranks and Order Statistics
What is the rank of an observation?
The rank of an observation is its position in the data after sorting. Ranks are useful in many nonparametric statistical methods, that is, methods that don’t require a distributional assumption such as normality.
What are the order statistics?
The order statistics of a data set are the values of the data when sorted from smallest to largest. The kth order statistic is the kth smallest value in the data, denoted y(k). Order statistics are useful in nonparametric statistics.
How do you find ranks?
Suppose you have data collected on a continuous variable. If you sort the data in ascending order, you can assign a rank to each observation. The minimum gets rank 1, the second ordered observation gets rank 2, and so on.
You can choose to ignore ties and simply assign an observation with the same value as a previous observation with the next rank, or you can use the midrank instead. The midrank is the observation’s rank if it is not tied and its average rank if it is tied.
Example of finding ranks and order statistics
Suppose you collect the following data on particle counts on a semiconductor wafer.
| Wafer | Particles |
| 1 | 0 |
| 2 | 222 |
| 3 | 0 |
| 4 | 56 |
| 5 | 3 |
| 6 | 5 |
| 7 | 0 |
| 8 | 0 |
| 9 | 22 |
| 10 | 5 |
| 11 | 0 |
| 12 | 0 |
| 13 | 71 |
| 14 | 7 |
| 15 | 11 |
| 16 | 6 |
| 17 | 1 |
| 18 | 0 |
To find the ranks, sort the data, then assign the values 1-18 to the sorted data. To find the midranks, replace the rank with the average rank for observations with the same value. The order statistics are the sorted data.
| Wafer | Particles | Rank | Midrank | Order Statistic |
| 1 | 0 | 1 | 4 | y(1) |
| 3 | 0 | 2 | 4 | y(2) |
| 7 | 0 | 3 | 4 | y(3) |
| 8 | 0 | 4 | 4 | y(4) |
| 11 | 0 | 5 | 4 | y(5) |
| 12 | 0 | 6 | 4 | y(6) |
| 18 | 0 | 7 | 4 | y(7) |
| 17 | 1 | 8 | 8 | y(8) |
| 5 | 3 | 9 | 9 | y(9) |
| 6 | 5 | 10 | 10.5 | y(10) |
| 10 | 5 | 11 | 10.5 | y(11) |
| 16 | 6 | 12 | 12 | y(12) |
| 14 | 7 | 13 | 13 | y(13) |
| 15 | 11 | 14 | 14 | y(14) |
| 9 | 22 | 15 | 15 | y(15) |
| 4 | 56 | 16 | 16 | y(16) |
| 13 | 71 | 17 | 17 | y(17) |
| 2 | 222 | 18 | 18 | y(18) |
Why are ranks important?
Ranks can replace data in nonparametric hypothesis tests.
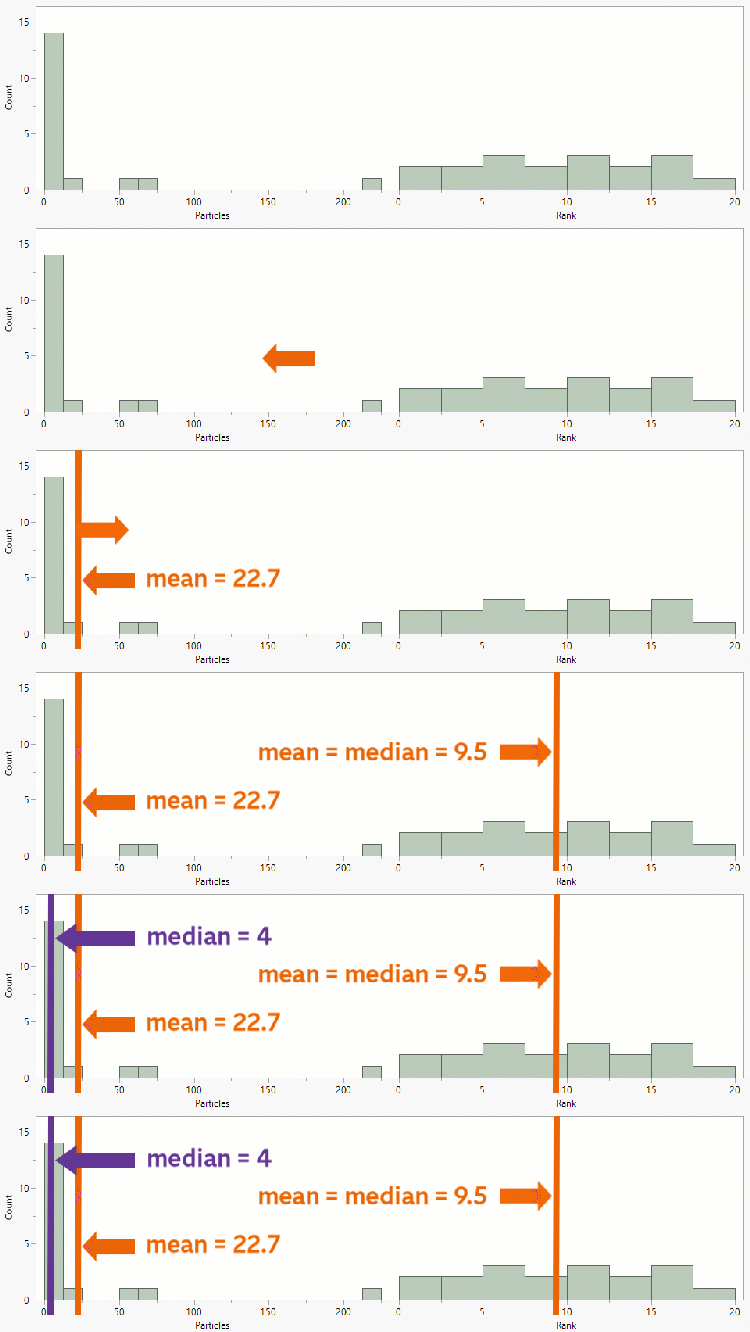
In the figure below, both the particle data and their ranks are plotted using a histogram. The distribution of particles is highly skewed, while the distribution of ranks is symmetric. The median is more representative than the mean for measuring the center of the distribution of particles, while the mean and median of the ranks are the same.
Tests based on ranks can be used when the usual distributional assumption of normality does not hold. Some examples of nonparametric tests and the parametric test they replace are as follows:
- Wilcoxon signed rank test (one-samplet-test)
- Wilcoxon rank sum test, Mann-Whitney test (two-samplet-test)
- Kruskal-Wallis test (oneway ANOVA)
- Median test (oneway ANOVA)
- Kolmogorov Smirnov two-sample test (two-samplet-test)
Why are order statistics important?
The order statistics of a variable are used to find important summary statistics, such as the minimum, maximum, median, and other quantiles of data.
Statisticians have found the probability distribution of order statistics of data sampled from various probability distributions. Knowing the distribution of order statistics helps to model values like the kth biggest value, which can be important in product reliability, patient survival, financial models, and others.