Wilcoxon Signed Rank Test
What is the Wilcoxon signed rank test?
The Wilcoxon signed rank test is a hypothesis test that determines if the median value of a sample of data is different from a specified value. This test is a nonparametric alternative to the one-samplet-test. In most cases, the one-sample t-test is the appropriate test for ascertaining the center of a distribution. The Wilcoxon signed rank test is an appropriate alternative test when the data distribution is not normal but is still symmetric.
The test statistic is based on the sum of the signed ranks. The difference between each data value and the sample median is calculated, then the absolute values of the differences are ranked. The rank then takes the sign of the difference, that is, if the difference is positive, the rank is simply the rank unchanged; if the difference is negative, the rank is the negative of the rank. If the difference is zero, the rank is zero.
The Wilcoxon signed rank test assumes your data come from a symmetric distribution. Since the one-sample t-test is robust to departures from normality when the data are symmetric and bell-shaped, the Wilcoxon signed rank test is especially useful when your data are symmetric but not bell-shaped.
The signed rank test is also used for a pairedt-test when the normality assumption on the differences is false, but the distribution of differences is still symmetric. You can take the differences in observations and apply the one-sample Wilcoxon signed rank test on the median difference.
Example of the Wilcoxon signed rank test
Suppose you produce parts manufactured in lots and measure the yield of each lot. The yield is the percent of parts in the lot that are deemed good by an automated inspection system. Historically, your process produces either very good or very bad lots. That is, there are lots with low yield (near 0%) and high yield (near 100%), but only a small proportion with yield in the middle of 0% to 100%. After a process change, you would like to test the hypothesis that the median of the yield distribution is greater than 80%.
Your data are in the following table.
| Lot | Lot Yield |
| 1 | 2.1 |
| 2 | 4.7 |
| 3 | 6.3 |
| 4 | 8.9 |
| 5 | 11.5 |
| 6 | 14.2 |
| 7 | 18.8 |
| 8 | 51.3 |
| 9 | 84.7 |
| 10 | 88.9 |
| 11 | 91.2 |
| 12 | 94.8 |
| 13 | 96.1 |
| 14 | 98.3 |
| 15 | 99.4 |
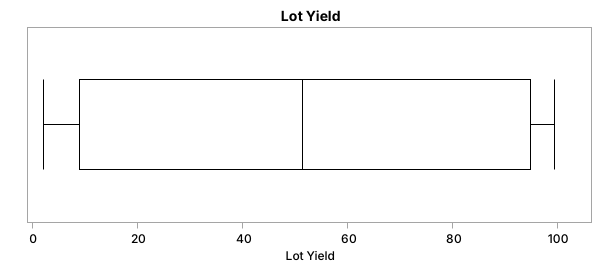
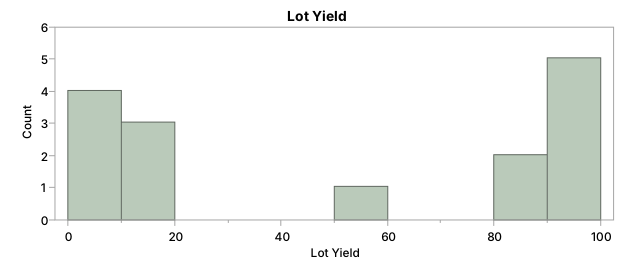
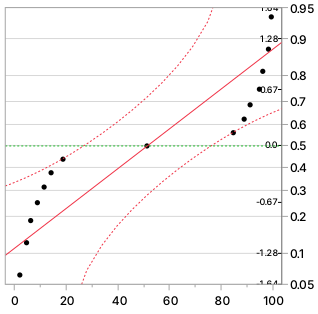
A box plot, histogram, and normal quantile plot of the data show the distribution doesn’t appear to be normal, but it does appear symmetric. Remember that the t-test still works well even if your data aren’t normally distributed, as long as you have either many data values (at least 30 values, but more is better) or a distribution that is at least bell-shaped. Here, we don’t have many data values, and the data are not bell-shaped, meaning that this is a rare case when the t-test is not appropriate. It is, however, a great scenario for the Wilcoxon signed rank test!
As seen with the large p-value of 0.9635 in the figure below, the Wilcoxon signed rank test fails to reject the null hypothesis that the population median is 80% or higher. You conclude the population median is less than 80%.