Hypergeometric Distribution
What is the hypergeometric distribution?
The hypergeometric distribution is a discrete probability distribution that describes the probability of a given number of successes in a sample drawn without replacement from a finite population. Sampling without replacement means the probability in each trial is dependent on the outcomes in the previous trials, because the composition of the population changes as each trial removes an item from it. Therefore, the probabilities in individual trials in the hypergeometric distribution are not independent, as they are in the binomial distribution.
What are some examples of the hypergeometric distribution?
A common scenario where the hypergeometric distribution is useful is counting the number of defective units in a sample. Suppose you have a lot of 100 units with a known defect rate of five percent, and you randomly draw a sample of 10 units without replacement. What is the probability of getting at least one defective unit in your sample? You can use the hypergeometric distribution to answer that question.
Other examples include finding the probability:
- That a 10-member committee will have at least five female members when randomly selecting from a pool of 120 faculty members, 40 of whom are women.
- That five cards drawn randomly from a deck of playing cards are all the same suit.
- That the number of black balls in a sample drawn from a jar containing a known number of black balls and a known number of white balls will be x.
When should you consider using the hypergeometric distribution?
The hypergeometric distribution is useful for modeling counts of data in a sample from a finite population composed of two categories, such as yes/no, pass/fail, etc. If you have more than two categories (for example, black, white, and gray balls in a jar), you can find probabilities of the number of black balls drawn by grouping the white and gray balls together into a category called “not black.”
Characteristics of the hypergeometric distribution
Let’s continue with the example of a jar filled with black and white balls, where N is the total number of balls in the jar, K is the number of black balls in the jar (therefore N−K is the number of white balls in the jar), and n is the number of balls drawn in a sample.
The hypergeometric probability mass function is derived by counting how many ways there are to select x black balls from K total black balls and n – x white balls from N – K total white balls, and then dividing by the total number of ways to select the sample of n balls from the total population of N balls.
| Model parameters |
N, population size K, number of black balls in the population n, number of balls in a sample |
| Mass function | $ p(X=x)=\frac{\binom{K}{x}\binom{N-K}{n-x}}{\binom{N}{n}},\; x=0,1,2,\ldots,N $ |
| Mean | $\frac{nK}{N}$ |
| Variance | $ n\frac{K}{N}\frac{N-K}{N}\frac{N-n}{N-1} $ |
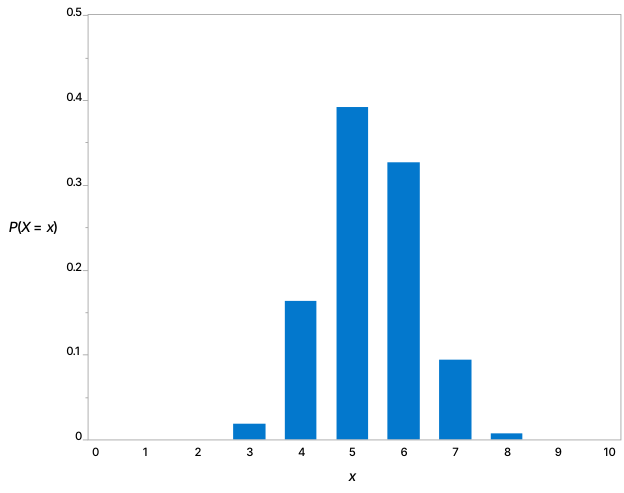
The image below shows an example of the hypergeometric distribution, where the total number of balls in the jar, N, is 15; the population is composed of seven (K) black balls and eight white balls; and the sample size, n, is 10. In this scenario, the mean number of black balls in a sample is 10 x (7/15) = 4.6.