JMP Pro 17 features two new platforms to help you analyze your genetic data and use that data to simulate a breeding program to predict the optimum genetic crosses to make. These platforms are accessible from the Analyze > Genetics menu.
Marker Statistics
The Marker Statistics platform provides a convenient method for exploring several properties of all the biallelic markers in a data set, for the purpose of quality control (QC) and possibly selecting markers to be removed from the analysis.
The following example uses the Genotypes Pedigree.jmp data set found in the JMP Sample Data folder (Help > Sample Data Folder > Life Sciences). This simulated data set contains genotypes for 60 markers for 100 individuals.
8
Select Help > Sample Data Folder > Life Sciences and open Genotypes Pedigree.jmp.
8
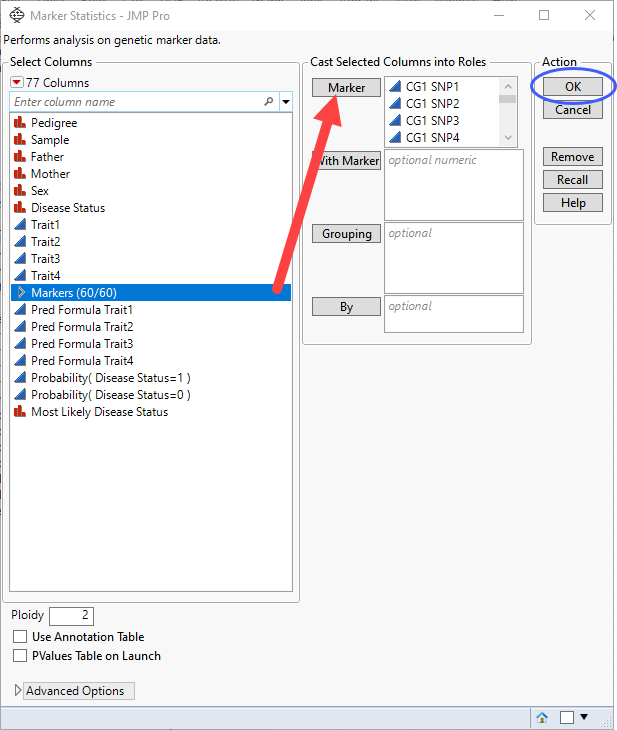
Select Analyze > Genetics > Marker Statistics.
8
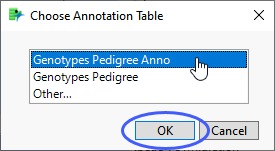
Select the Markers group as the Markers.
8
Click OK.
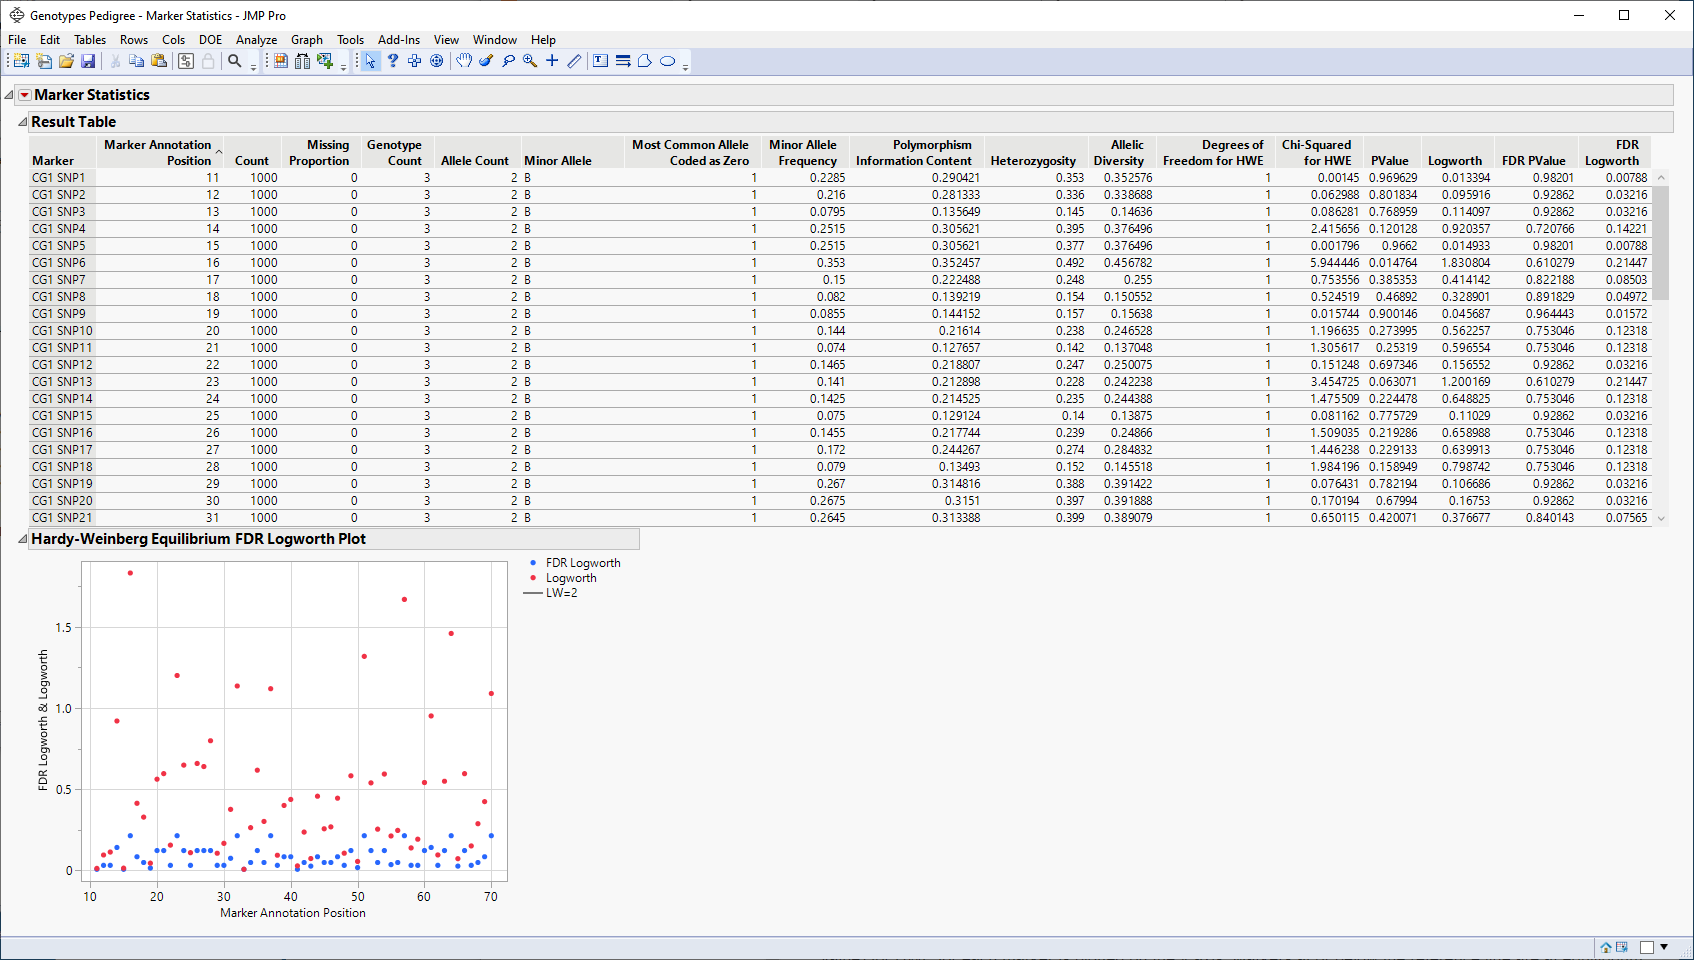
The following report is generated:
The Result table provides statistics for each of the markers analyzed.
The Hardy-Weinberg Equilibrium plot shows how close each of the markers are to equilibrium. The column number of each marker in the JMP table is plotted on the x-axis. The Logworth-adjusted p-value and -log10(p-value) for HWE for each marker is plotted on the y-axis. Markers at or below the reference line are at equilibrium, markers above the line are not. The farther from the reference a marker is, the further the marker is from equilibrium.
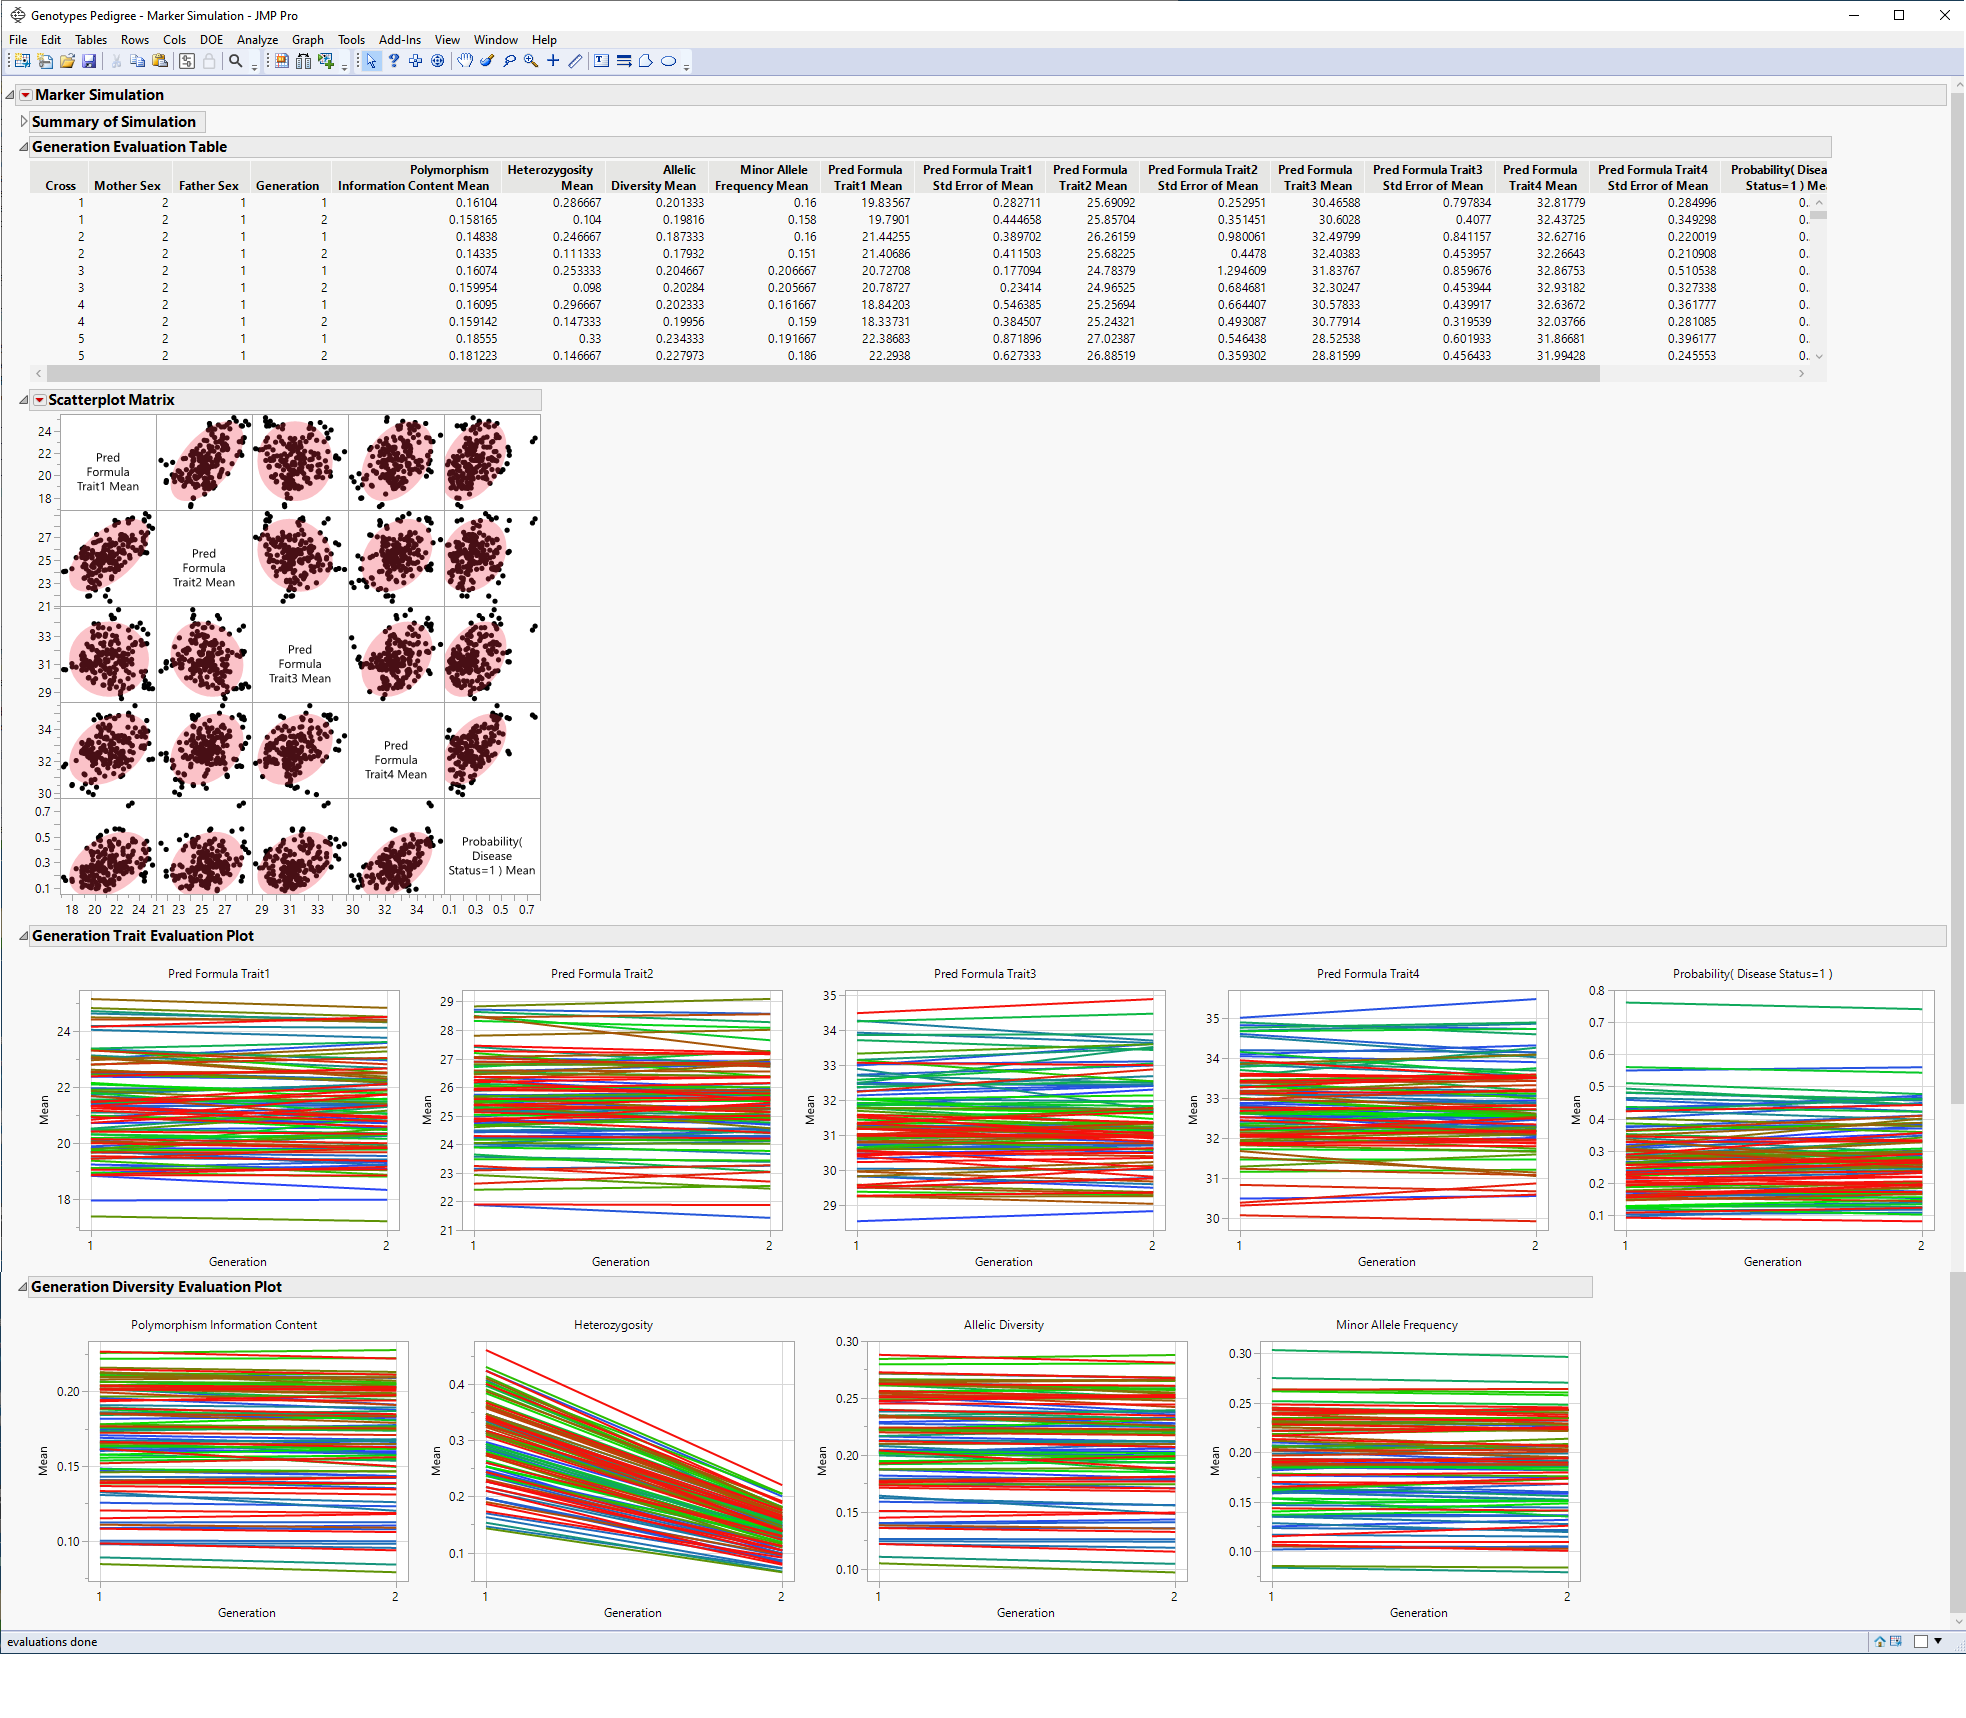
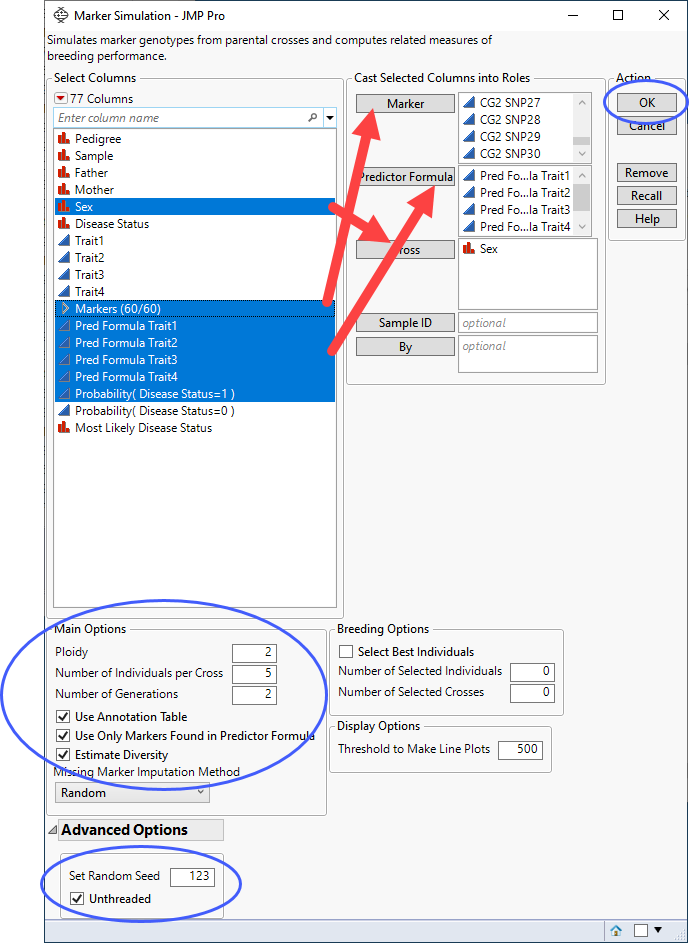
The Marker Simulation platform simulates marker genotypes from parental crosses and computes related measures of breeding performance. This process uses biallelic marker data and trait levels along with computed predictor formulas to simulate genetic crosses and resulting progeny across multiple generations to enable users to design the most effective design for producing progeny with the desired combination of traits.
This platform requires predictor formulas. These formulas are developed on historical data where an event has been measured or inferred and are generated using one or more predictive modeling processes using predictive platforms in JMP, for example, Fit Model, Response Screening, XGBoost, etc. The predictive models are then applied to new data for which the attributes are known, but the event has not yet occurred. See Generating Predictor Formulas for Marker Simulation for details.
The following example uses the Genotypes Pedigree.jmp and Genotypes Pedigree Anno.jmp data sets found in the JMP Sample Data folder (Help > Sample Data Folder > Life Sciences). This simulated data set contains genotypes for 60 markers for 100 individuals along with data on expression of 4 genetic traits. The data set also contains predictor formulas for all four traits. The annotation data set contains annotation information for each of the markers.
8
Select Help > Sample Data Folder > Life Sciences and open Genotypes Pedigree.jmp and Genotypes Pedigree Anno.jmp.
8
Click on the Genotypes Pedigree.jmp table.
8
Select the first twenty rows in the table.
Note: This example analyzes the first twenty rows only.
 and select Show Evaluation Plot and Show Diversity Plot to generate the report shown here: