Quality Control and Normalization
After importing data, the first thing you will typically want to do is to verify the data are correct both structurally and distributionally. JMP Pro is an excellent tool for exploratory data analysis, and many of its standard tools and platforms are great for inspecting the quality of your genomics data tables and normalizing or standardizing them as needed.
The place to begin is the imported JMP tables themselves. Inspect them carefully and make sure the rows and columns are as expected. Look along the left hand side of every JMP table to see a description of the columns and rows. Next, several basic JMP platforms are available to perform rapid statistical summaries and graphs. These are described in detail below with examples.
Distribution
Use the Distribution platform to explore the univariate distributions of a single variables using histograms, box plots, and summary statistics. You can perform several types of hypothesis tests, including t tests, z tests, chi-squared tests, and equivalence tests. You can also construct confidence, tolerance, and prediction intervals, and estimate process capability.
The following example uses the Genotypes Pedigree.jmp data set found in the JMP Sample Data folder (Help > Sample Data Folder > Life Sciences). This simulated data set contains genotypes for 60 markers and data for 4 traits for 100 individuals.
| 8 | Open the Genotypes Pedigree.jmp data set. |
| 8 | Click Analyze > Distribution. |
| 8 | Select the 4 Trait columns as the Y, Columns. |
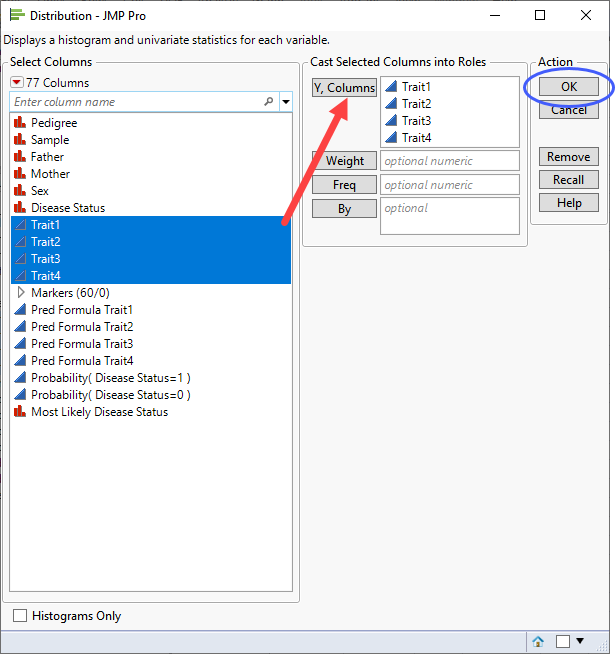
| 8 | Click . |
The following report is generated:
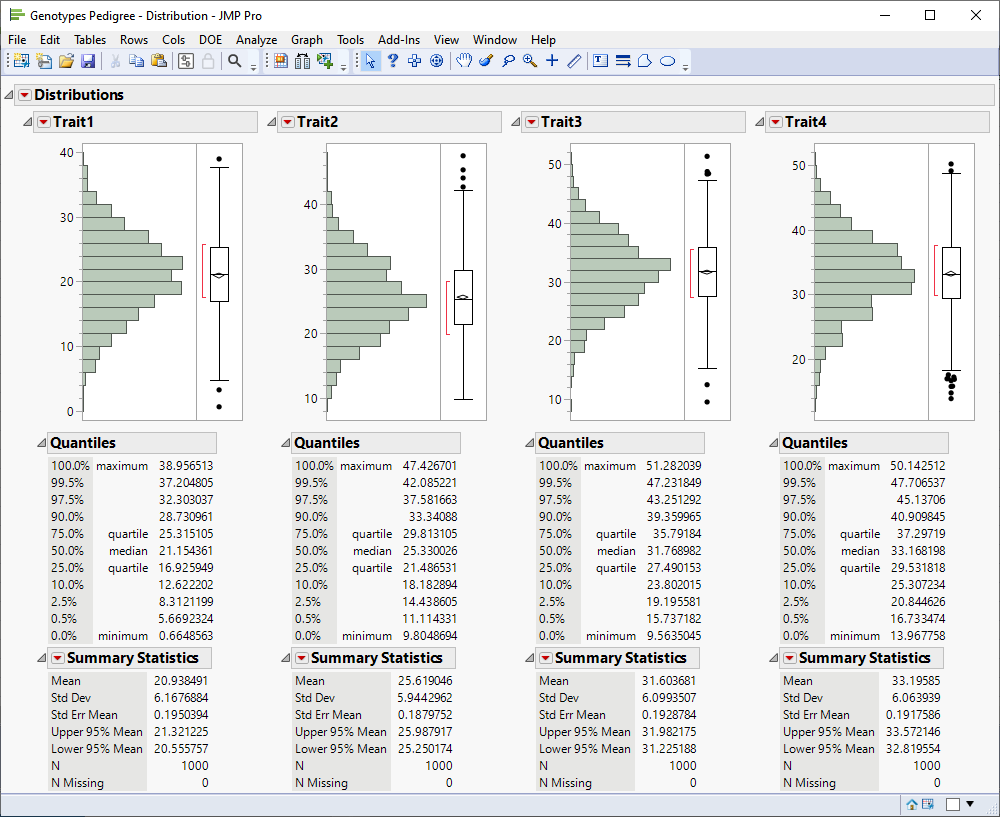
A histogram and box plot is generated for each column showing the distribution of the values for the respective traits. In addition, summary statistics are generated for each column. The plots and statistics enable you to get an overall feel for the data and can provide an indication of the overall quality of the data.
Multivariate
Use the Multivariate platform to explore how multiple variables relate to each other. The Multivariate platform provides many techniques to summarize and test the strength of the linear relationship between each pair of response variables. Both parametric and nonparametric correlations tests are available in the platform. You can also use graphical features, such as the Scatterplot Matrix and Color Maps, to identify dependencies, outliers, and clusters among the variables.
The following example uses the Genotypes Pedigree.jmp data set found in the JMP Sample Data folder (Help > Sample Data Folder > Life Sciences). This simulated data set contains genotypes for 60 markers and data for 4 traits for 100 individuals.
| 8 | Open the Genotypes Pedigree.jmp data set. |
| 8 | Click Analyze > Multivariate Methods > Multivariate. |
| 8 | Select the 4 Trait columns as the Y, Columns. |
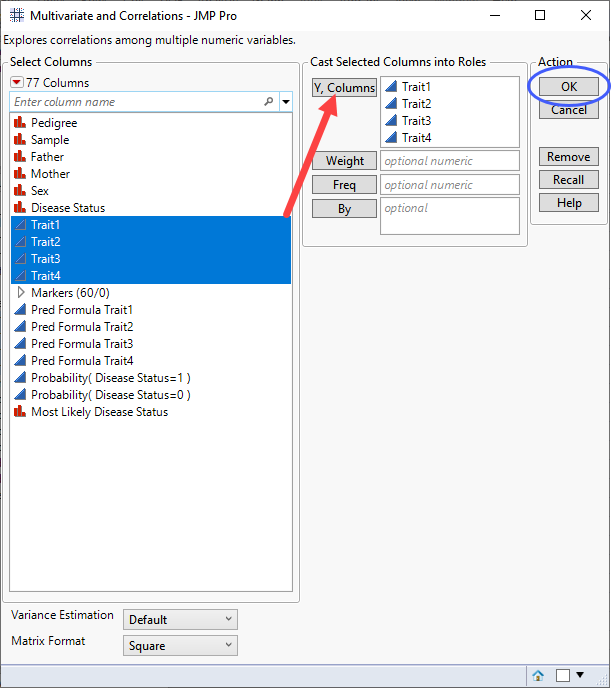
| 8 | Click . |
The following report is generated:
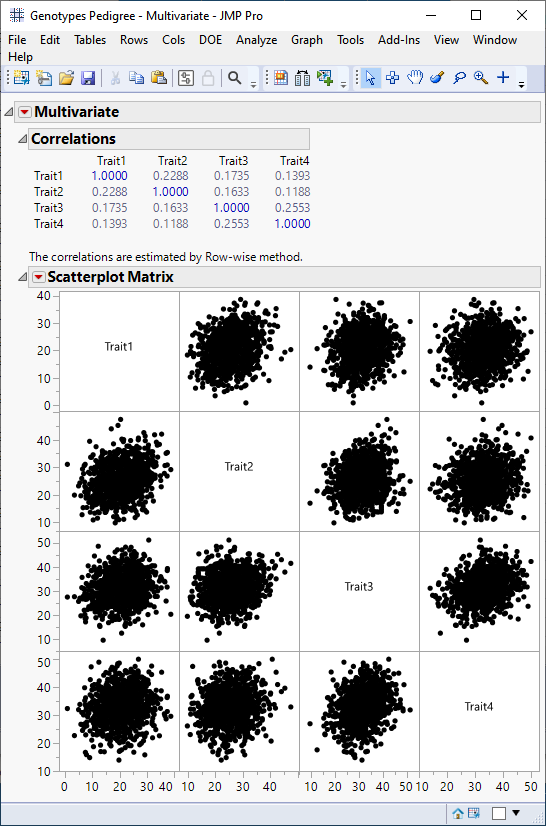
Summary statistics and a scatter plot show no significant correlation between traits, suggesting they occur independently of each other
Column Transformation
You can transform the data in one or more columns using the New Formula Column option accessible by right-clicking in the header of one or more selected columns. The transformed data is contained in new columns added to the right of the selected columns.
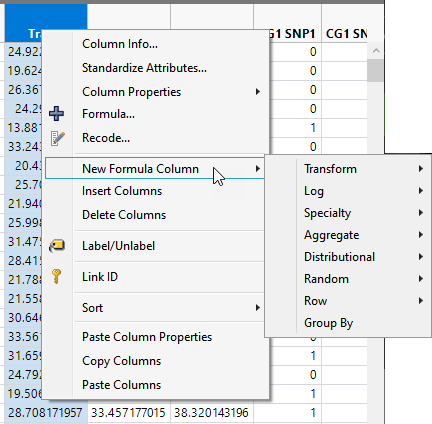
The most useful transformations include options under the Transform and Log menus.
![]()

Data transformations are useful in both genetic studies and expression studies. Rounding values is especially useful when imputing missing genotype data results in non-interger results. Using log-transformed values in analysis of expression data adjusts the scale of any plots of this data to a more consistent and manageable level, reduce skewness, and to effectively smooth out the observations, when compared with using raw values.
Outliers
Outliers in data can be due to mistakes in data collection or reporting, measurement systems failure, the inclusion of error or missing value codes in the data set, or simply an unusual value. The presence of outliers can distort estimates and bias results toward those outliers. The Explore Outliers platform enables you to identify, explore, and manage outliers.
Analysis of crown width among a cohort of loblolly pine trees, revealed one outlier (line 1085648, row 61).
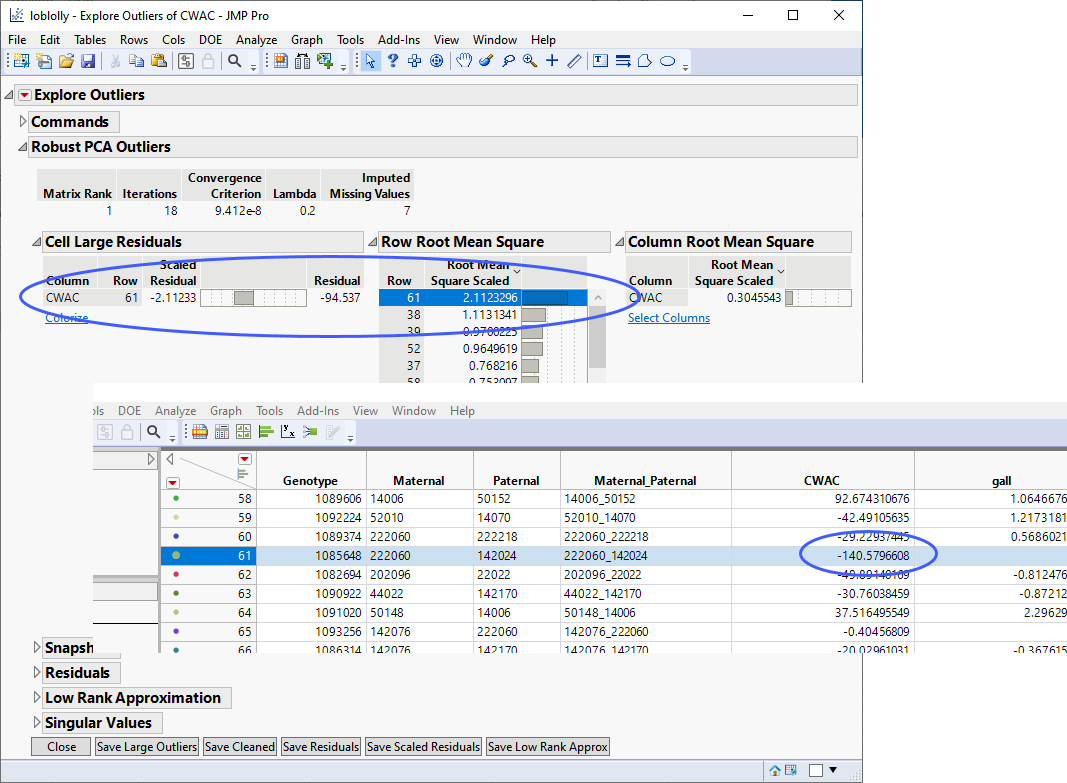
The effect of this outlier was observed in a volcano plot generated during a Genome-Wide Association Study (GWAS) of this data (see Genome-Wide Association (GWAS)).
Missing Values
The presence of missing values in a data set can prevent numerous JMP platforms from working with your data or, for those analyses that can be run, might affect the conclusions made using that data. The Explore Missing Values platform (Analyze > Screening > Explore Missing Values) provides several ways to identify and understand the missing values in your data. There are also methods for conducting multivariate imputation for missing values.
The data used as an example in this chapter is from a study of the accuracy of different genomic selection methods in Loblolly pine by Resende, et al. 20121 and was downloaded from GEO, opened in JMP, and saved as the loblolly.jmp table shown below. A zip file containing this JMP table is available here for you to download.
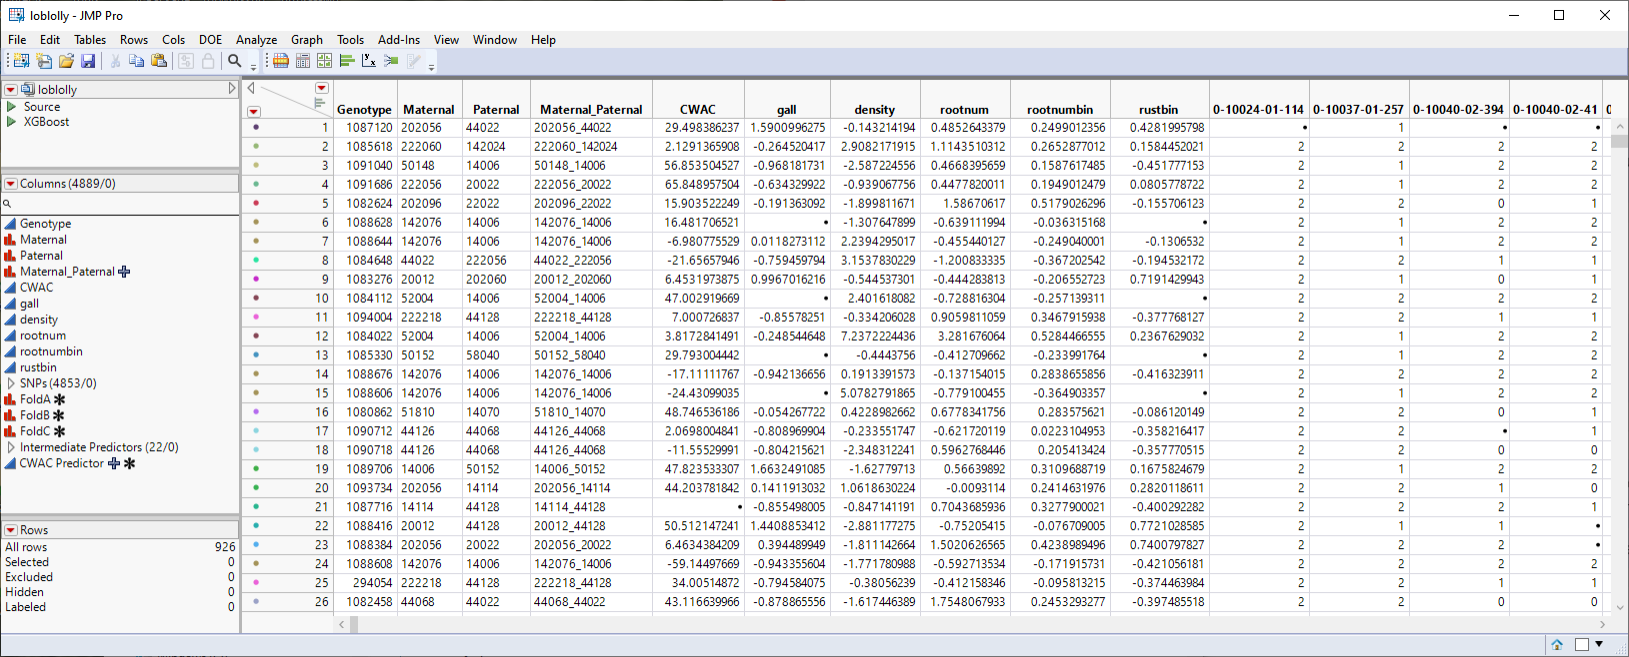
Examination of this table reveals a significant amount of missing data. We can use the Explore Missing Values platform to impute the missing values.
| 8 | Open the loblolly JMP table. |
| 8 | Click Analyze > Screening > Explore Missing Values. |
| 8 | Select the six trait columns and the SNPs group as the Y, Columns. |
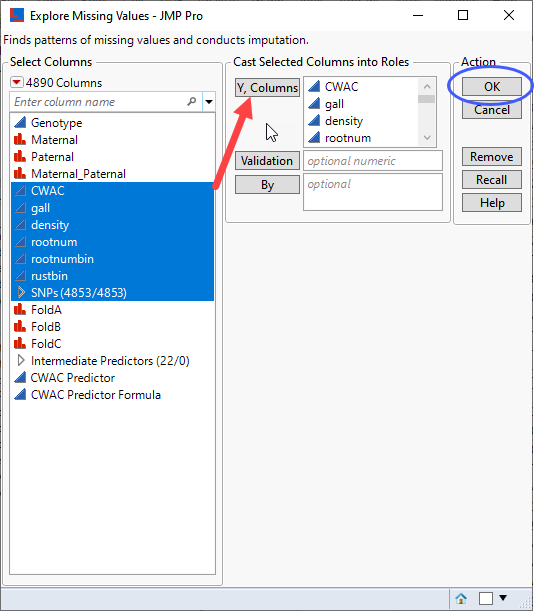
| 8 | Click . |
The following report is generated:

The report lists the number of missing values in each column. Those missing too many values should probably be excluded from the analysis. In addition, there are a number of commands enabling you to further characterize the missing values, as well as methods for imputing the missing values. Not all imputation methods are appropriate for all data sets. You should evaluate your data and choose an appropriate method. In this example, we have a large data set with nearly 5000 data columns to be imputed, and either of the two multivariate methods are likely to be the appreciate.
| 8 | Click . |
The Imputation Method window appears.

| 8 | Click |
The missing values in data set are replaced with the imputed values.