Multivariate Inliers and Outliers
This report calculates Mahalanobis distance based on available data, using the equation 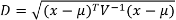 , to identify subject inliers and outliers in multivariate space from the multivariate mean. Refer to the JMP documentation on Mahalanobis Distance Measures for statistical details. It also generates results by site to see which sites are extreme in this multivariate space.
Mahalanobis distance is plotted on the log scale to allow for easier examination of small scores. The reference line is derived from a transformation of the mean of the approximate chi-square distribution.
This report attempts to use as much data as possible. Along with sex and age, it takes all findings test codes by visit number and time number (if available), as well as frequencies of all event and intervention codes per subject. Of course, doing so can lead to missing data particularly for studies that do not appear to have a fixed number of visits or with lots of dropouts. Because Mahalanobis distance cannot be calculated with lots of missing data present, there is an option to delete variables with at least X% of missing data based on the selected population and filters (default of 5%). Of remaining variables, scores are computed for those subjects with complete data. The general strategy of this report is to use as many variables as possible, while letting a few early dropouts fall out of the analysis.
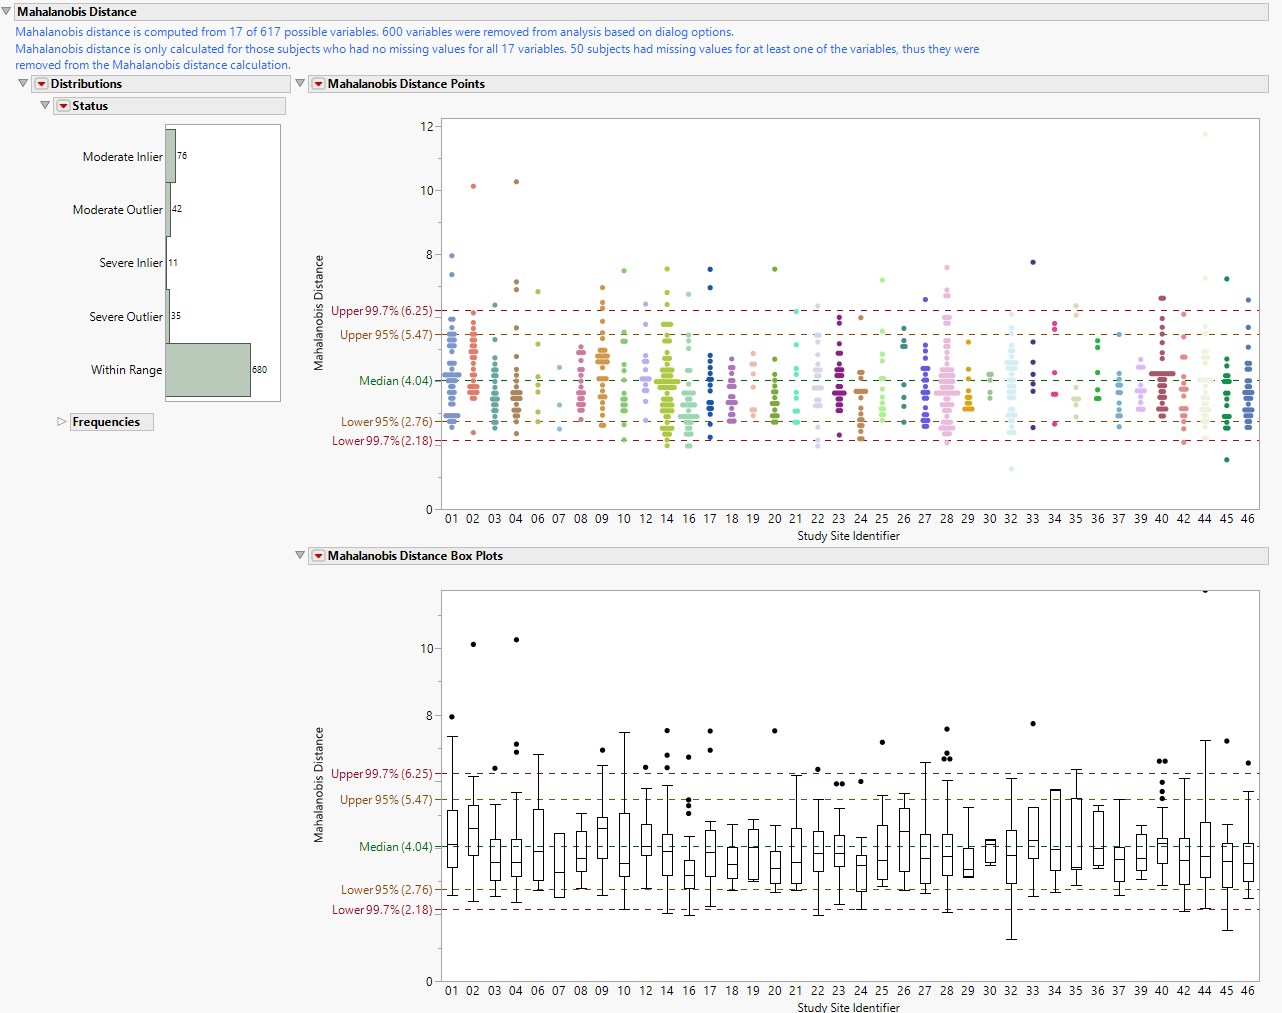
Note: Missing data is shown in the tabular data pane that can be viewed by clicking the  drill down option. A Missing Flag value of 1 indicates variables with a missing rate of <5%. A Missing Flag value of 2 indicates variables with a missing rate of >5%, based on the default dialog option of 5%.
Report Results Description
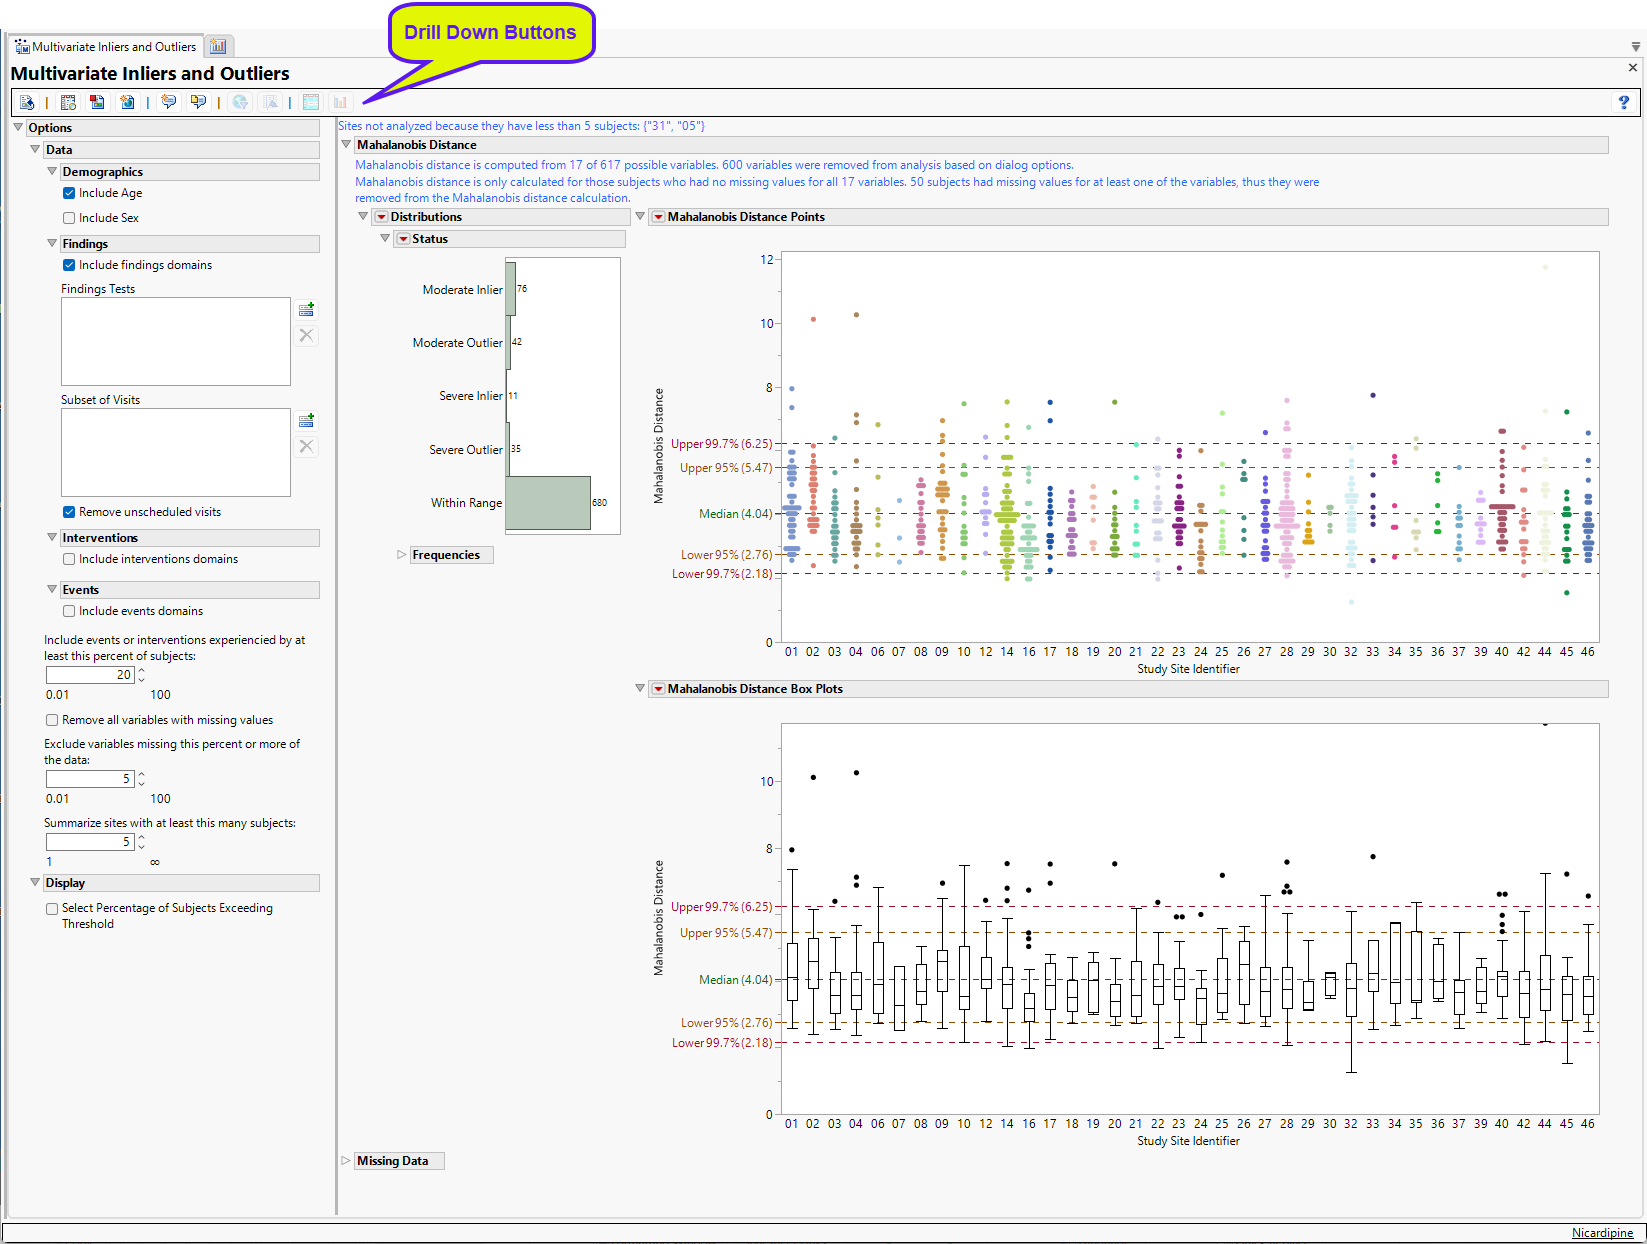
For the Nicardipine example shown here, 17 out of 617 variables have missing data rates below 5% and are kept. 50 subjects had missing values for at least one of these 17 variables, thus they were removed from the Mahalanobis distance calculation.
Running this report for Nicardipine using default settings generates the Report shown below.
The report initially shows two sections.
Mahalanobis Distance
Presents plots of Mahalanobis Distances of all subjects (distance is from the multivariate mean), colored by study site, and Box Plots presented by sites.
This section contains the following elements:
| • | One Status Distribution plot showing total subjects in each inlier/outlier grouping. |
| • | One JMP Mahalanobis Distances plot to identify significant outliers. In the Mahalanobis Distances plot shown above, the distance of each specific observation from the mean center of the other observations from the site is plotted. Those points residing above the upper 95% confidence interval (outliers) or below the lower 95% confidence interval (inliers) correspond to those rows that warrant the most attention due to their significant distance from the mean center of all other observations. The region between 95% and 99.7% is referred to as a moderate inlier or outlier depending of it is in the lower or upper bounds, respectively. Beyond 99.7 is considered a severe outlier or inlier. |
| • | One Box Plot. |
The second figure replaces points seen in the Mahalonobis plot with box plots by study site. This allows the analyst to better determine how different sites are from the multivariate mean.
Missing Data
This section has the following elements:
| • | Two Histograms. |
Details variables that contain missing data that prevented Mahalonobis distances from being calculated for certain subjects (Flag = 1) or variables that were dropped from analysis based on the option Remove variables from analysis with a missing data percentage of at least:. By default, variables with 5% or more of missing data are not used in the calculation of Mahalanobis Distance. Data are presented either as counts (left) or percentages (right) reflect the number of values that are missing for each variable. Opening the data table shows the percentage of missing data for each test.
General and Drill Down Buttons
Action buttons, provide you with an easy way to drill down into your data. The following action buttons are generated by this report:
| • | Click  to rerun the report using default settings. to rerun the report using default settings. |
| • | Click  to view the associated data tables. Refer to Show Tables/View Data for more information. to view the associated data tables. Refer to Show Tables/View Data for more information. |
| • | Click  to generate a standardized pdf- or rtf-formatted report containing the plots and charts of selected sections. to generate a standardized pdf- or rtf-formatted report containing the plots and charts of selected sections. |
| • | Click  to generate a JMP Live report. Refer to Create Live Report for more information. to generate a JMP Live report. Refer to Create Live Report for more information. |
| • | Click  to take notes, and store them in a central location. Refer to Add Notes for more information. to take notes, and store them in a central location. Refer to Add Notes for more information. |
| • | Click  to read user-generated notes. Refer to View Notes for more information. to read user-generated notes. Refer to View Notes for more information. |
| • | Click  to open and view the Review Subject Filter. to open and view the Review Subject Filter. |
| • | Click  to specify Derived Population Flags that enable you to divide the subject population into two distinct groups based on whether they meet very specific criteria. to specify Derived Population Flags that enable you to divide the subject population into two distinct groups based on whether they meet very specific criteria. |
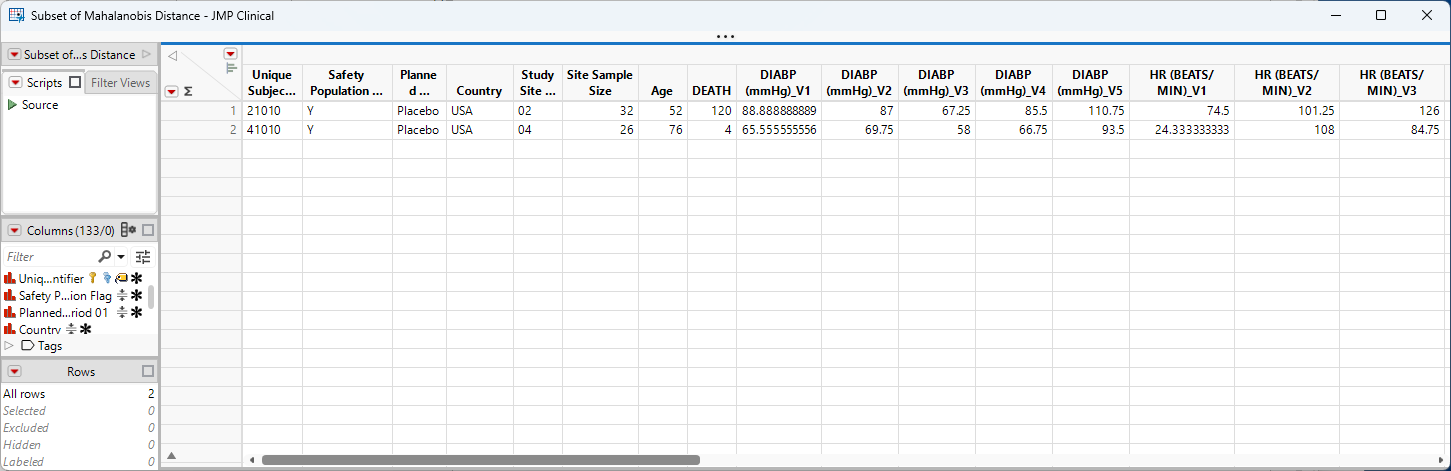
| • | Show Sites: Shows the rows of the data table for the selected points from Mahalanobis Distance Points or Box Plots graphs. Clicking  opens the following table: opens the following table: |
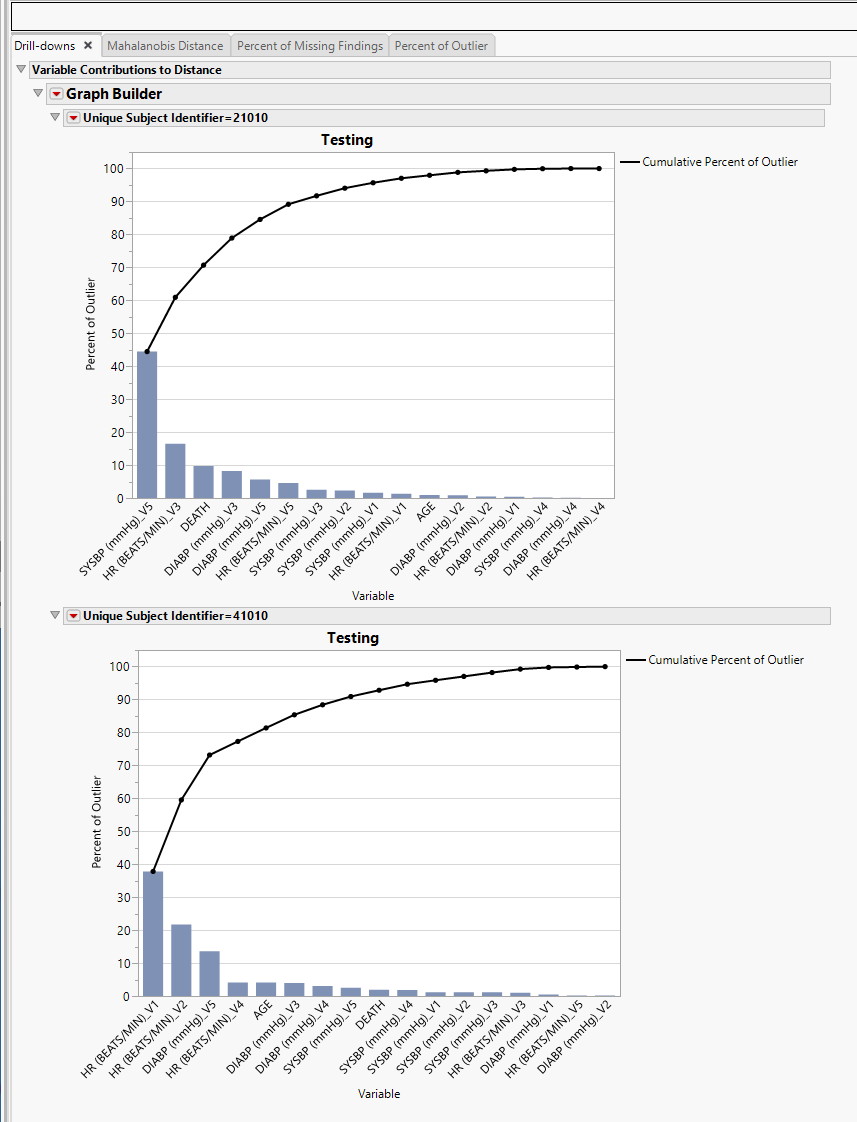
| • | Variable Contributions to Distance: Select subjects and click  to create Pareto plots for each subject that explain how much each variable contributes to a patient being an outlier, with a total possible of 100% for each subject. Analysis of the Pareto plots can enable you to view how selected subjects are extreme for the selected covariates. to create Pareto plots for each subject that explain how much each variable contributes to a patient being an outlier, with a total possible of 100% for each subject. Analysis of the Pareto plots can enable you to view how selected subjects are extreme for the selected covariates. |
Options
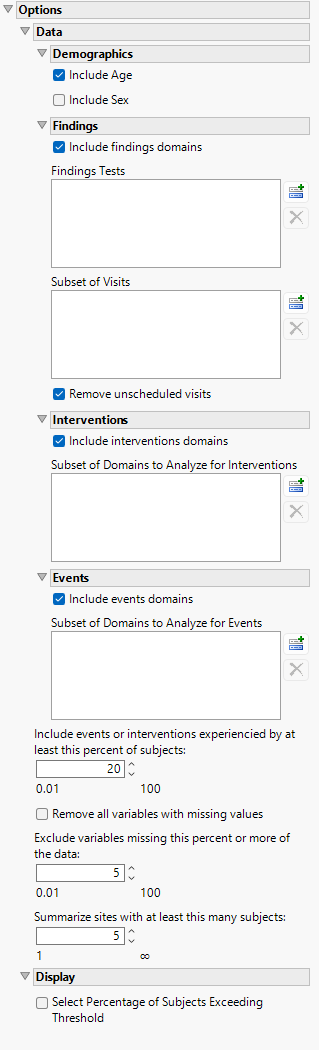
Data
Include Age
Use this widget to include age of the subjects in the analysis.
Include Sex
Use this widget to include gender of the subjects in the analysis.
Include findings domains
Check this option to include data from the findings domains in the analysis.
Findings Tests
Use this widget to select Findings Tests for the analysis. The report will autorun and analysis is restricted to the selected tests only. This option is available only when the Include findings domains option is selected.
Subsets of Visits
Use the Subset of Visits option to select the visits to be included in the analysis.
Remove unscheduled visits
You might or might not want to include unscheduled visits when you are analyzing findings by visit. Check the Remove unscheduled visits to exclude unscheduled visits.
Include intervention domains
Check this box to include data from the Intervention domains in the analysis.
Subset of Domains to Analyze for Interventions
Use this widget to select specific subsets of the Interventions domains for the analysis. The report will autorun and analysis is restricted to the specified subdomains only. This option is available only when the Include intervention domains option is selected.
Include events domains
Check this box to include data from the Event domains in the analysis.
Subset of Domains to Analyze for Events
Use this widget to select specific subsets of the Event domains for the analysis. The report will autorun and analysis is restricted to the specified subdomains only. This option is available only when the Include events domains option is selected.
Include events or interventions experienced by at least this percent of subjects
The Include events or interventions experienced by at least this percent of subjects widget enables you to set a threshold number of subjects that must experience an event/intervention for it to be considered significant enough to be included in the analysis.
Remove all variables with missing values
Check this option to remove any variables with missing data from the analysis.
Exclude variables missing this percent or more of the data:
The Exclude variables missing this percent or more of the data: widget enables you to set a maximum percentage of missing data a variable may contain to be included in the analysis. Variables containing missing data exceeding the percentage specified here are excluded from the analysis.
Summarize sites with at least this many subjects
The Summarize sites with at least this many subjects: widget enables you to set a minimal threshold for the sites to be analyzed. Only those sites which exceed the specified number of subjects are included. This feature is useful because it enables you to exclude smaller sites, where small differences due to random events are more likely to appear more significant than they truly are. In larger sites, observed differences from expected attendance due to random events are more likely to be significant because any deviations due to random events are less likely to be observed.
Display
Select Percentage of Subjects Exceeding Threshold
Use the Select Percentage of Subjects Exceeding Threshold option to select a proportion of patients based on exceeding a threshold.
Methodology
Scores for all findings tests are computed as described above.