Adverse Events Recurrence
Most analyses of adverse events (AEs) are based on the presence or absence of events at the patient level. For example, if a patient experiences one or more headaches, they are considered a “success” in that the event occurred (= 1). Patients who do not experience a headache are considered failures (= 0). The number of patients who experience one or more headaches are tabulated for each treatment arm, and the proportion (or odds ratio or risk ratio) of subjects experiencing a headache are compared between treatment arms. This comparison is conducted separately for every AE that occurs within a study. Here, patients that experience one event versus many events are weighted identically with no distinction made for the number of events a patient may experience (save for a patient who experiences no events).
Recurrence analysis acknowledges that an AE may occur more than once within a patient and accounts for these re-appearances within the analysis. Going further, recurrence analysis accounts for the timing at which events occur beyond comparing the final total of events that patients may experience.
The Adverse Events Recurrence report within JMP Clinical utilizes the JMP Recurrence Analysis platform to obtain the mean cumulative function (MCF), which shows the total cost per unit as a function of time. In a clinical trial, the MCF shows the total number of events per patient as a function of time.
When using CDISC standards, the AE or ADAE data sets summarize the events that were experienced by patients in the study, but more information is needed. In order to conduct a recurrence analysis, dates representing the start and end of an appropriate follow-up period need to be defined for all patients, not just those who experience a particular AE. Further, the derivation of the appropriate follow-up dates will depend on the types of AEs of interest for analysis (see below).
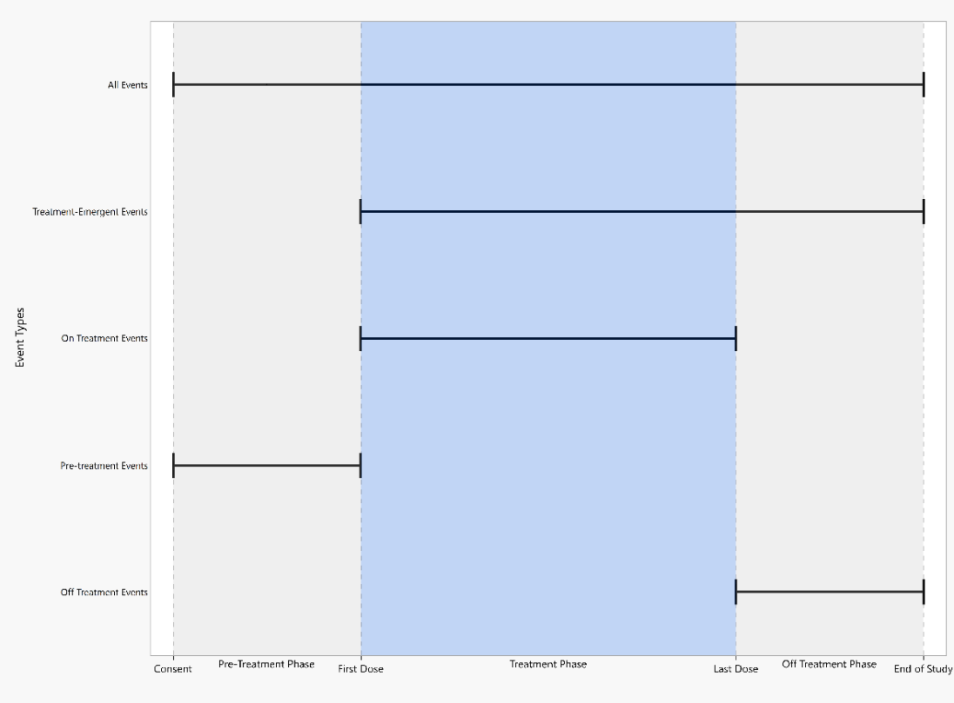
The figure above displays start and end dates appropriate for different types of events. Dates used to define follow up period are described below, and they are considered in the order of presentation.
Note: Visit End Date is equivalent to Visit Start Date if it is not available.
All Events include any AEs that may occur on study once informed consent is signed until the patient ends study participation.
| • | Start date: Consent Date or Enrollment Date or Earliest Visit Start Date |
| • | End date: End of Participation or End of Study or Maximum of (Latest Visit End Date, Latest date for Disposition Events from the DS domain) |
Treatment Emergent Events include any AEs that may occur on or after the first dose of study therapy determined by the treatment arm.
| • | Start date: First Treatment Date |
| • | End date: End of Participation or End of Study or Maximum of (Latest Visit End Date, Latest date for Disposition Events from the DS domain) |
On Treatment Events include any AEs that may occur on or after the first dose of study therapy and before or at the last dose of study therapy.
| • | Start date: First Treatment Date |
| • | End date: Last Treatment Date |
Pre-Treatment Events include any AEs that may occur prior to the first dose of study therapy.
| • | Start date: Consent Date or Enrollment Date or Earliest Visit Start Date |
| • | End date: First Treatment Date |
Off Treatment Events include any AEs that may occur after the last dose of study therapy.
| • | Start date: Last Treatment Date |
| • | End date: End of Participation or End of Study or Maximum of (Latest Visit End Date, Latest date for Disposition Events from the DS domain) |
For Screen Failures, the following changes apply:
All Events
| • | No changes |
Pre-Treatment Events
| • | Any events are considered to have occurred before treatment since treatment was never received |
| • | End date: End of Participation or End of Study or Maximum of (Latest Visit End Date, Latest date for Disposition Events from the DS domain) |
Excluded from Treatment Emergent, On treatment, and Off Treatment events since no treatment was received.
Note: The Recurrence Report is not valid for crossover studies due to the limitations of the statistical methods in computing treatment differences (which assumes treatment arms are independent).
Report Results Description
Running this report with the Nicardipine sample data, where the On treatment events option was selected for event type and defaults were selected for all other options, generates the tabbed Results shown below (click image to enlarge). Output from the report is organized into sections. Each section contains one or more plots, data panels, data filters, or other elements that facilitate your analysis.
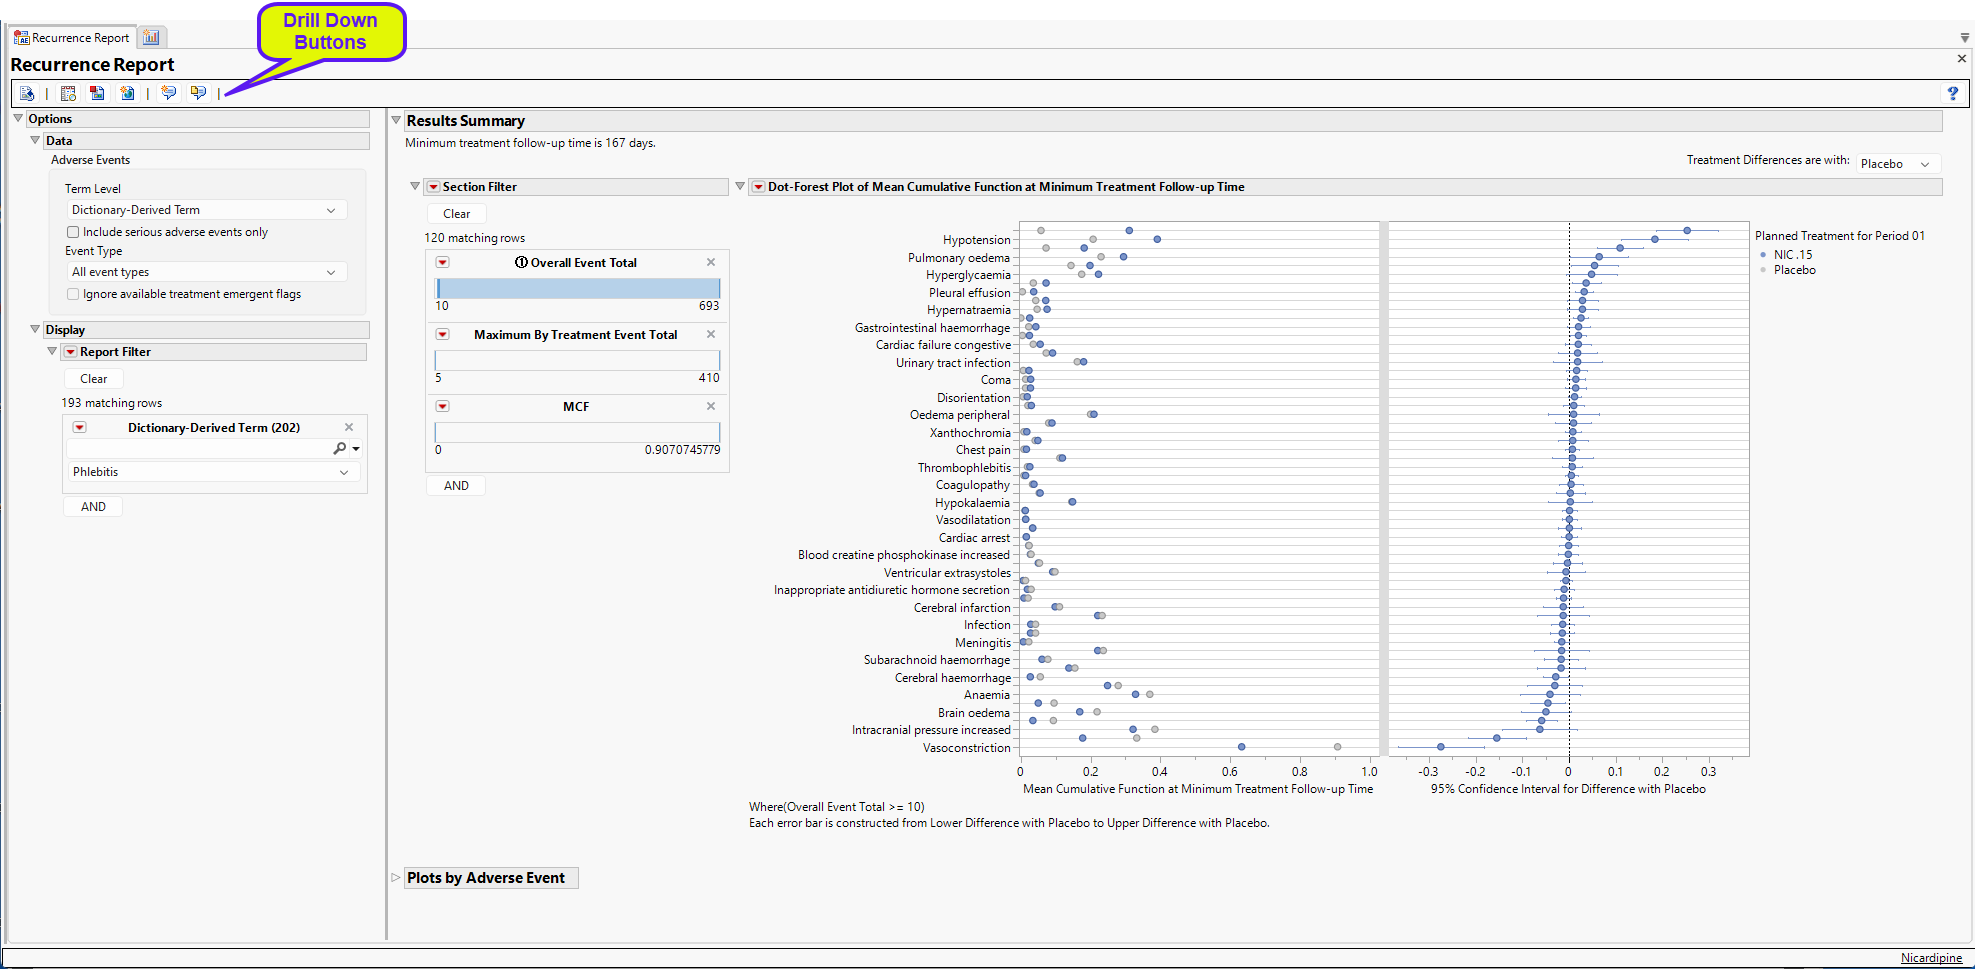
(click image to enlarge)
The Recurrence Report generates analyses for studies with one or more treatment arms and computes treatment differences between all treatments for studies with two or more treatment arms.
The Report contains the following elements:
Results Summary
For studies with two or more treatment arms, differences between the treatment arms are compared at the minimum of the maximum follow-up times for the treatments. Here, the minimum follow-up time is 17.5 days.
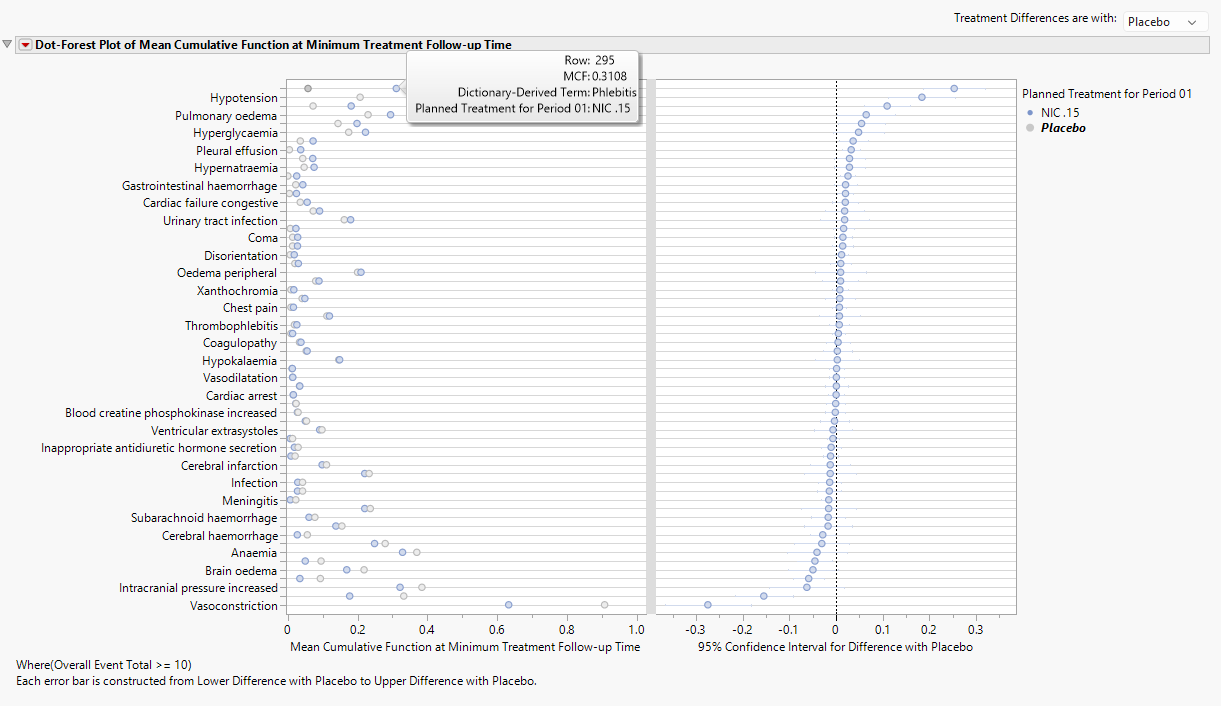
Dot-Forest Plot Summary of all AEs
(click image to enlarge)
For studies with two or more treatment arms, differences between the treatment arms are compared at the minimum of the maximum follow-up times for the treatments. Here, the minimum follow-up time is 17.4 days. The dot plot in the left panel shows the value of the MCF at 17.4 days while the forest plot displays the 95% confidence interval for the difference in NIC. 15 – Placebo MCFs. This difference can be reversed by altering the control arm with the combo box. From the dot plot, the MCF 0.3844 and 0.0756 for NIC. 15 and Placebo, respectively, for phlebitis. In other words, patients can expect to experience 0.3844 or 0.0756 phlebitis events by 17.4 days for NIC. 15 and Placebo, respectively. So, one in every 1/0.3844 = 2.6 patients will experience a phlebitis event by 17.4 days.
Note: For single arm studies, the dot-forest plot will be replaced with a forest plot that presents the 95% confidence intervals for the MCF computed at the maximum follow-up time within the treatment arm.
Data Filter
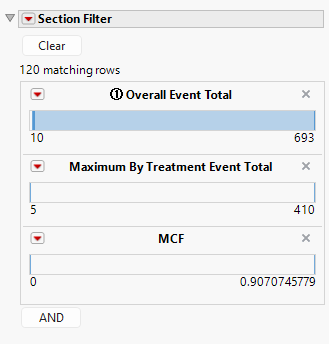
The data filter has variables to subset the dot-forest plot by the overall event total, the maximum by treatment event total, or the MCF, though other variables may be added.
Max Difference Plot
(click image to enlarge)
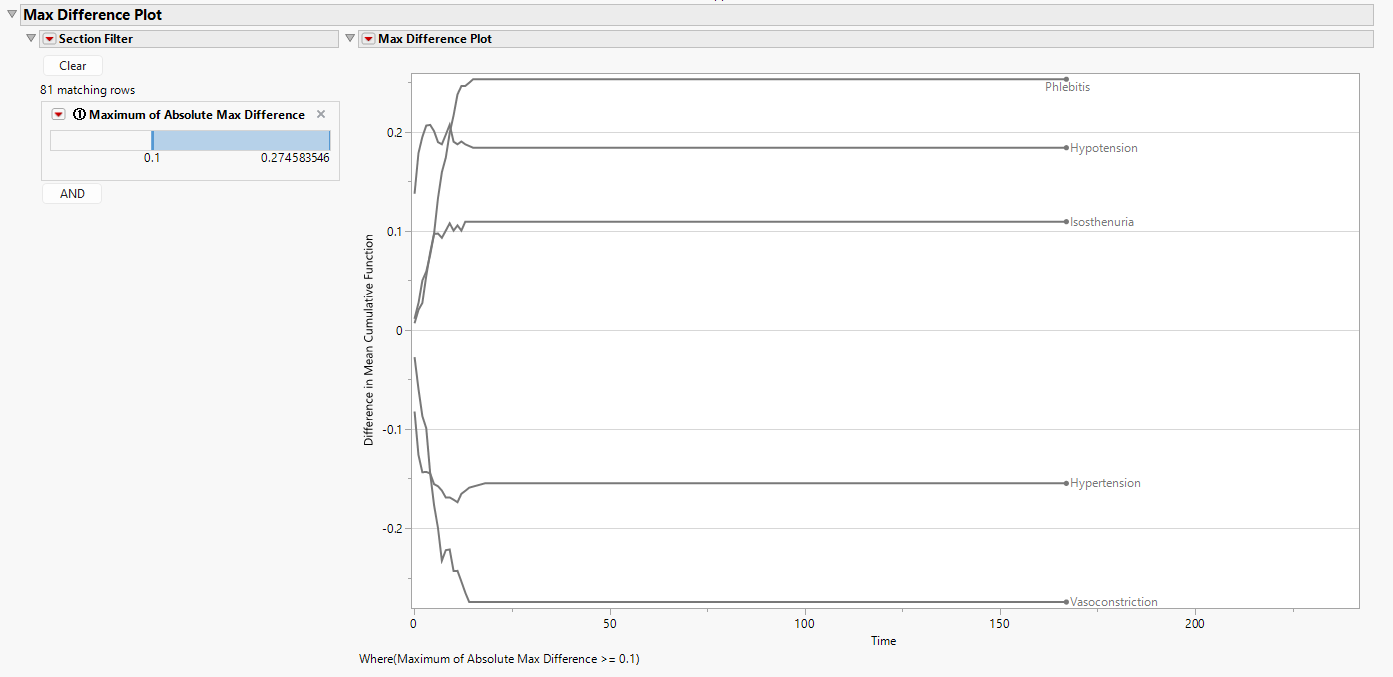
While the Dot-Forest Plot is useful for identifying treatment differences among AEs at the end of follow-up (the minimum of the maximum of follow-up times), this ignores any differences that could be present earlier in the study. The Max Difference Plot (above) provides a summary of all AEs across the entire duration of the study as an alternative way to explore specific events in detail. Simply put, the Max Difference Plot takes the maximum observed value of the mean cumulative function (MCF) across all treatments and subtracts the minimum observed value of the MCF, thereby summarizing the maximum difference at each time point across all treatments. In this case, the minimum value of the y-axis would be 0 (since differences would always be positive). In the special case of two treatments, the Max Difference Plot communicates direction between the two treatments by taking the differences in the MCFs between the first treatment minus the second treatment. Effectively, this definition makes the plot similar to the Differences in Mean Cumulative Function Plot below, except here all AEs are presented. Note that this plot is not produced in the case where only a single treatment arm is available.
Summarizing all AEs across time within a single plot can be particularly crowded. To make the Max Difference Plot more interpretable, the Section Filter utilizes the Maximum of Absolute Max Difference to subset to the most interesting events. By default, this value is 10%, meaning that only AEs that experience at least a 10% difference among the treatments at least once over the course of the study are presented. For the Nicardipine study presented above, only 5 AEs meet this threshold. Phlebitis, Hypotension, and Isosthenuria show increased risk for Nicardipine (since the result is generally positive), while Hypertension and Vasoconstriction show increased risk for Placebo (since the result is generally negative).
Recall that for more than two treatments, the differences presented in the Max Difference Plot are the maximum differences observed across all pairs of treatments at any given time point. This enables the user to find AEs where large differences are occurring; subsetting to these interesting events will allow them to better understand the direction of these differences among the treatments across time.
Plots by Adverse Event
The remaining plots in the report summarize a single event which can be selected from the Display Filter. By default, the event that maximizes the difference in MCF between the first and last treatments (based on sort order) will be displayed.
Event Plots
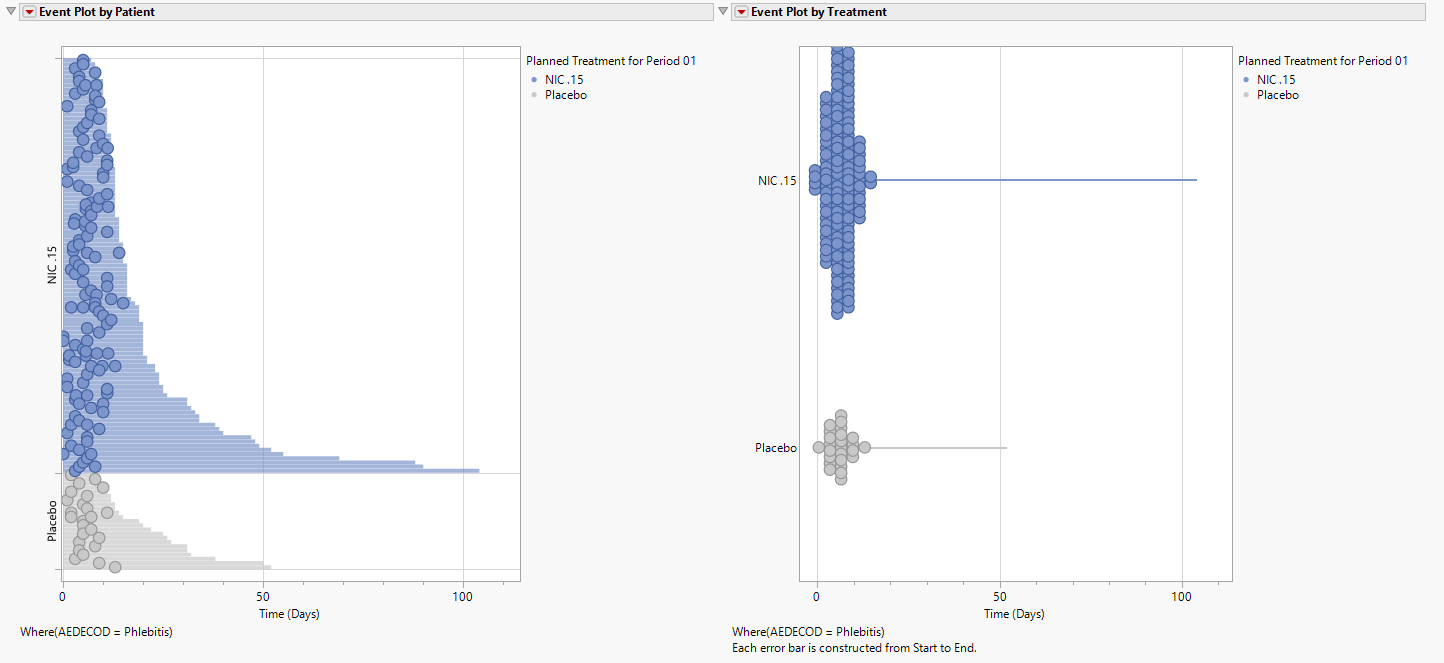
Event plots are produced to show when AEs occur across the follow-up time at the patient level (left) and treatment level (right).
(click image to enlarge)
Patients along the y-axis in the left hand plot are sorted according to the length of their follow-up time. The treatment-level event plot could be interpreted as the events occurring early and not beyond 13 days. However, this is due to a handful of participants with long follow-up times. As seen in the left hand plot, the phlebitis events occur pretty evenly across the follow-up time, particularly for the NIC.15 patients. Note that the bubble size is indicative of the number of events occurring at a given time. Should follow-up start and end dates not include a time component, larger bubbles would indicate multiple events occurring on a single day for a patient. This is less likely to occur when time is considered.
Note: For single arm studies, event plots are presented vertically to allow for greater visibility of the plots.
MCF Plot and Difference in MCF Plot
(click image to enlarge)
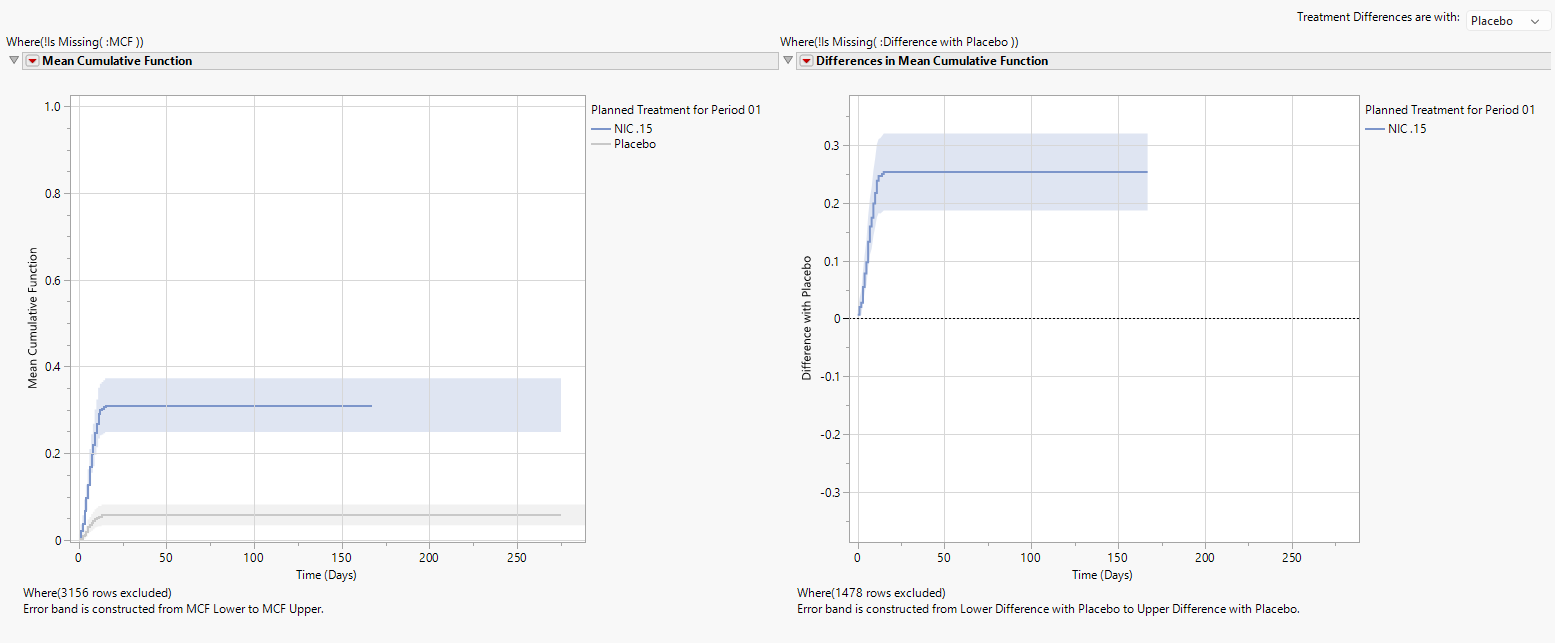
The top panel displays a plot of the MCF for each treatment and the pointwise 95% confidence band. The approximately straight line for the MCF (at least until about 13 days) shows that phlebitis AEs occur at a relatively constant rate over time. The MCF becomes horizontal beyond approximately 13 days indicating no additional phlebitis events occur.
The Number at Risk table, displayed at the bottom of the figure when All Patients is selected using the Number at Risk display option, communicates the number of patients who have yet to have an event or be censored. When Cumulative Events is selected using the Number at Risk display option, the total number of patients with events up to and including a particular time are presented in the risk table, which has now been renamed Cumulative Events. Numbers are presented every 30 days and at the last day of follow up.
Note: An MCF curve that is concave down would indicate that the time between phlebitis events is increasing, showing a decrease in phlebitis events. In other words, safety is improving for phlebitis events. An MCF curve that is concave up would indicate that the time between phlebitis events is decreasing, showing an increase in phlebitis events. In other words, safety is worsening for phlebitis events.
Note: For single arm studies, a Difference in Mean Cumulative Function plot is not applicable and is therefore not created.
Forest Plots of MCF and Difference in MCF Confidence Intervals
(click image to enlarge)
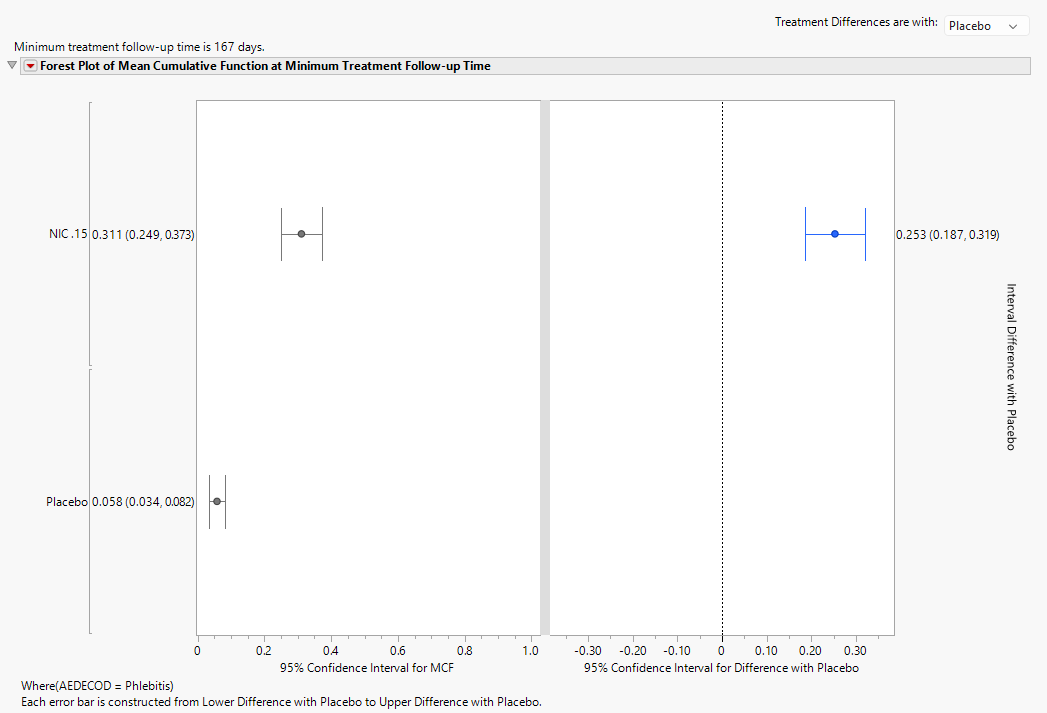
The dual forest plot presents the 95% confidence intervals graphically and in text of the MCF for each treatment as well as the pairwise differences for MCF at the minimum treatment follow-up time. Like the plots shown above, the control group can be selected using the combo box. The points in the left forest plot correspond to the dot plot; here, the confidence intervals are presented to show additional information.
Note: For single arm studies, the dual forest plot becomes an individual forest plot only showing the confidence interval graphically and tabularly.
Data Tables
Finally, should additional analysis insight be of interest from the JMP Recurrence Analysis platform, the Recurrence data table where Record Flag equals Patient can be used.
| 8 | Click  to view the underlying data table. to view the underlying data table. |
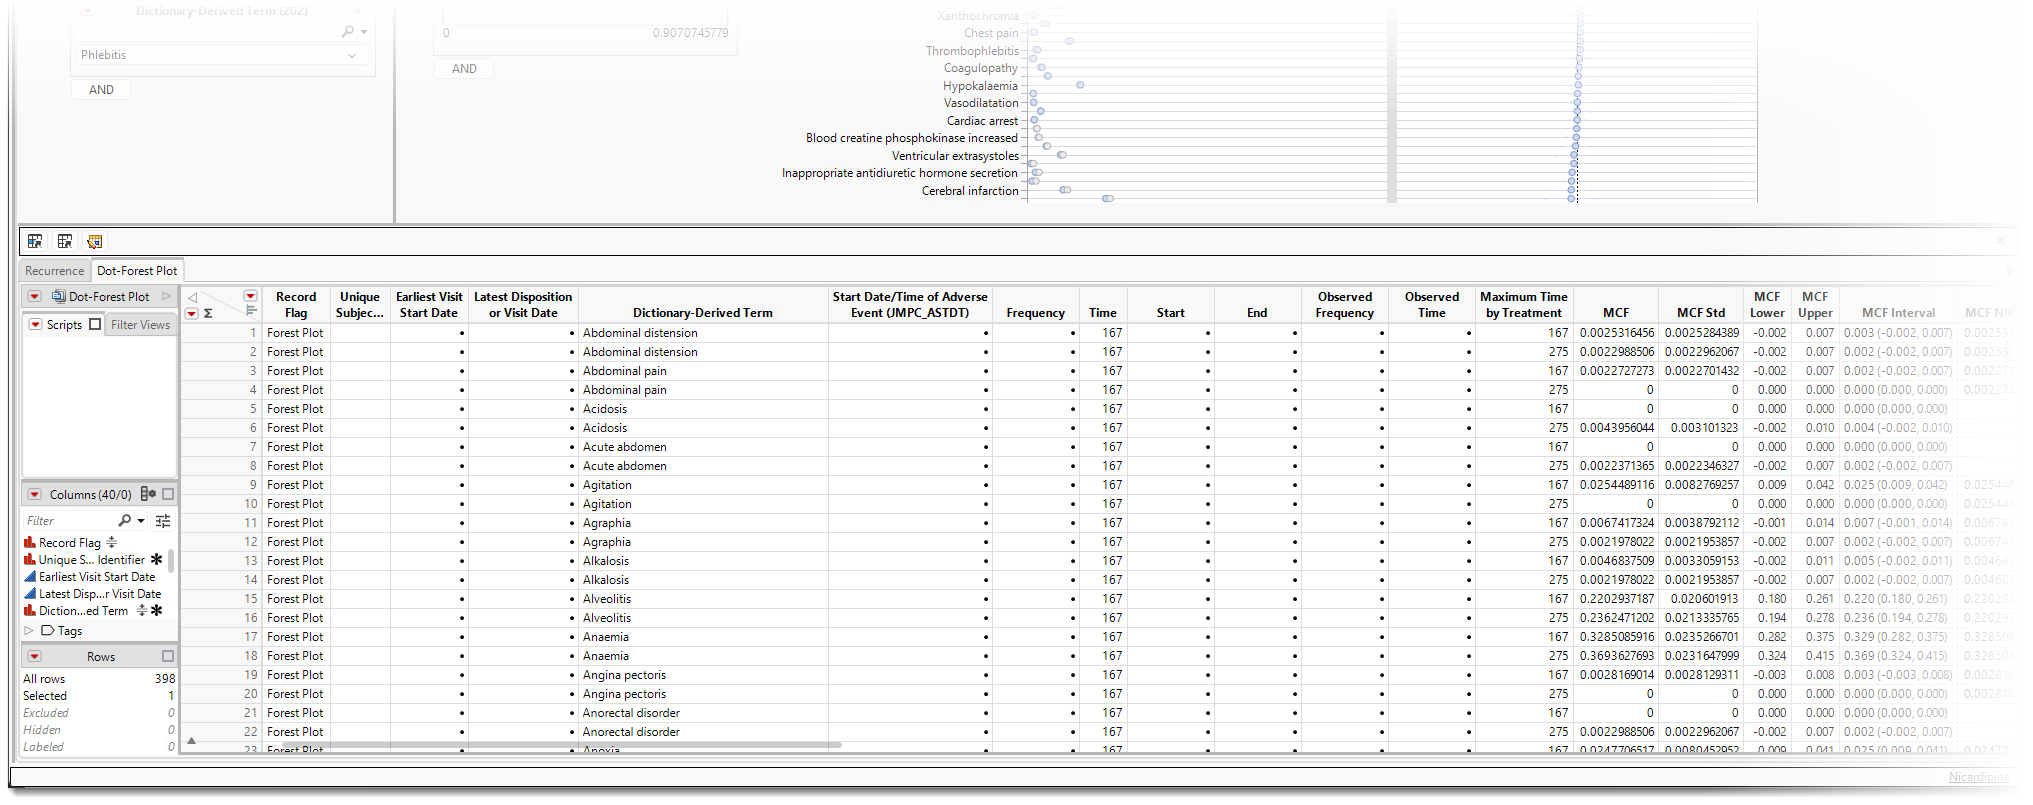
(click image to enlarge)
| 8 | Click  to open the data table as a JMP table. to open the data table as a JMP table. |
| 8 | Select Analyze > Reliability and Survival > Recurrence Analysis to open the Recurrence Analysis platform. |
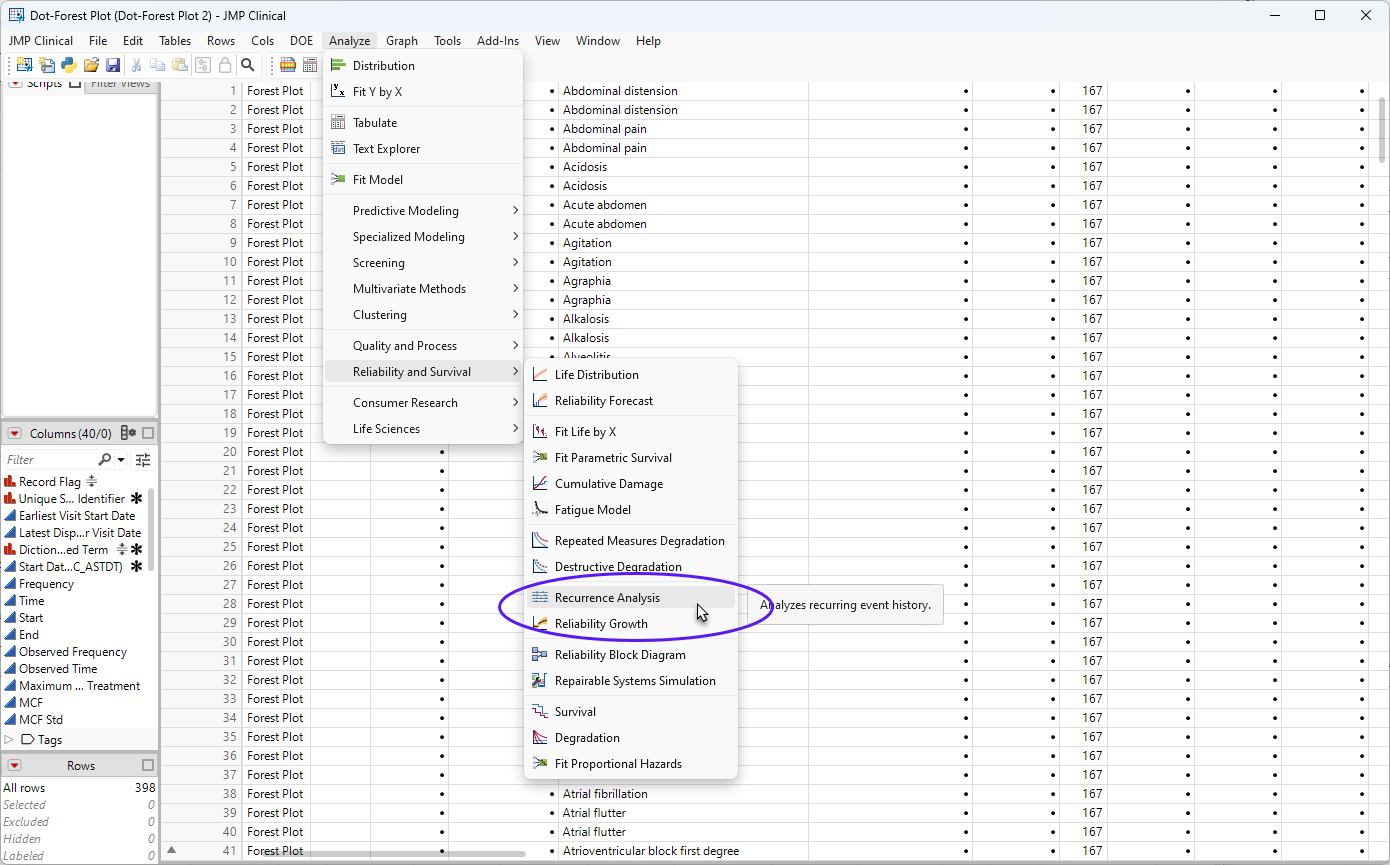
| 8 | Set the following options: |
| • | Y, Age, Event Timestamp will use the start date of the adverse event. |
| • | Label will use Unique Subject Identifier. |
| • | Cost will use Frequency. |
| • | Grouping will use Treatment. |
| • | Timestamp at Start/End will use the dates. |
| • | By will use event name, typically Dictionary-Derived Term if analyzing preferred terms. |
| 8 | Continue the analysis in JMP as described in the Recurrence Analysis platform documentation. |
Options
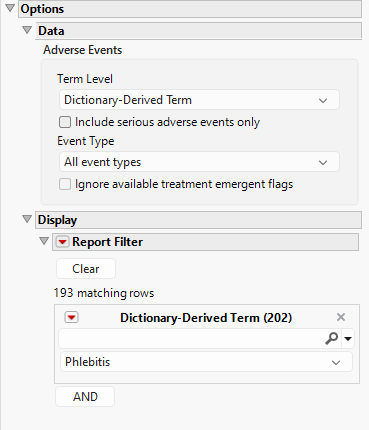
Data - Adverse Events
Term Level
Term Levels are determined by the coding dictionary for the Event domain of interest, typically these levels follow the MedDRA dictionary. Use this widget to specify how each adverse event is named and the level at which the event is considered. For example, selecting Reported Term for the Adverse Event reports the event specified by the actual event term as reported in the AE domain. Refer to Term Level for more information.
Include serious adverse events only
By default, all events are included in the analysis. However, you can opt to include only those considered serious. Checking the Include serious adverse events only widget restricts the analysis to those adverse events defined as Serious under FDA guidelines.
Event Type
Analysis can consider all events or only those that emerge at specific times before, during, or after the trial period. For example, selecting On treatment events as the Event Type includes only those events that occur on or after the first dose of study drug and at or before the last dose of drug (+ the offset for end of dosing).
Ignore available treatment emergent flags
If you choose to ignore available treatment emergent flags, the analysis includes all adverse events that occur on or after day 1 of the study.
Collapse Events
Checking this option, alone or when combined with available filters, groups events meeting the filter criteria into a single user-defined set of events. The first event in this set, no matter what it may be, is used to compute the time to the set of events.
Number at Risk Interval (days)
Enter the number of days comprising the block of time between study days where the number of subjects remaining in the study are reported.
Color Risk Table by Treatment
Use this option to color the numbers in the Risk Table by treatment.
Additional Filters - Adverse Events
This filter lets you restrict your analysis to only those subjects that meet specific criteria at the AE domain level. See Adverse Events for more information.
Note: To filter subjects with a specific event or finding, one could also use the Subpopulation Builder on any domain of interest. For example, filter to all subjects that exhibit cardiac failure ( :Customized Query 01 Name == "Cardiac failure" ) and run all reports on those.
Display
Number at Risk
Use this option to specify whether to calculate risk for all subjects or just those experiencing cumulative events. All Patients, which is set by default, displays the number of patients currently at risk in the analysis (i.e., those who have yet to have an event or be censored). Patients with Events displays patients currently experiencing an event. Cumulative Events displays the number of patients who have experienced an event by the given time point.
General and Drill Down Buttons
Action buttons provide you with an easy way to drill down into your data. The following action buttons are generated by this report:
| • | Click  to reset all report options to default settings. to reset all report options to default settings. |
| • | Click  to view the associated data tables. Refer to Show Tables for more information. to view the associated data tables. Refer to Show Tables for more information. |
| • | Click  to generate a standardized PDF- or RTF-formatted report containing the plots and charts of selected sections. to generate a standardized PDF- or RTF-formatted report containing the plots and charts of selected sections. |
| • | Click  to generate a JMP Live report. Refer to Create Live Report for more information. to generate a JMP Live report. Refer to Create Live Report for more information. |
| • | Click  to take notes, and store them in a central location. Refer to Add Notes for more information. to take notes, and store them in a central location. Refer to Add Notes for more information. |
| • | Click  to read user-generated notes. Refer to View Notes for more information. to read user-generated notes. Refer to View Notes for more information. |
Default Settings
Refer to Set Study Preferences for default Subject Level settings.
Methodology
Refer to the documentation for JMP's Recurrence Analysis platform for information on the statistical methods used to assess survival.
Note: Records marked as not occurring (xxOCCUR = N) are excluded from this analysis.
References
Doganaksoy N & Nelson W. (1998). A method to compare two samples of recurrence data. Lifetime Data Analysis 44: 51-63.