Exposure-adjusted Event Rates
This report screens all adverse events, tabulates the number of occurrences of each event, and calculates their incidence rates.
Click below to view a video summary of this report, or scroll down to read detailed descriptions of the report results and available options.
Methodology
Subjects are assessed for each adverse event they experience. The number of occurrences of each event is determined and used to calculate incidence rates using the following formula:

A case is considered new if a subject first develops symptoms after the start of the trial. Adverse events that occurr after a subject has recovered from a prior occurrence are considered new cases. Exposure time is typically defined as either total study time or time on treatment, depending on the selected option, unless the subject discontinues the study, an offset is specified, or a specific at risk time or event flag is specified.
Note: Records marked as not occurring (xxOCCUR = N) are excluded from this analysis.
Usage and Interpretation
The Exposure-adjusted Event Rates report was run using the Nicardipine sample data set under several scenarios to demonstrate the usage and interpretation of results.
Note: Click on the figures below to enlarge.
Example 1: Default Settings
The report was run using default the settings. Figure 1 shows a Bar Chart of the number of occurrences of each adverse event by treatment arm over the course of the study.
Figure 1:

Displayed counts indicate the total number of occurrences of an event. Counts can include one or more occurrences per patient.
Note: You can opt to display incidence rates instead of counts for adverse events.
Tabulate
The table presents an alternate view, listing the number of occurrences of each event and the corresponding incidence rates of subjects (shown in parentheses) for each treatment arm.

Incidence rates (IR per 100PY) represent the rate of new event occurrences per 100 patient-years of exposure to the treatment drugs or placebo.
Options
Data
Term and Group Levels
 View/Hide Details
This option allows for changing between MedDRA terms with the option to choose a single MedDRA term or a grouping of two MedDRA terms like Dictionary-Derived Term grouped by Body System or Organ Class. Switching this option swaps out the term plotted on the x-axis of the graph as well as the term in the first column of the tabulate.
Dictionary-Derived Term, grouped by Body System or Organ Class is selected by default.
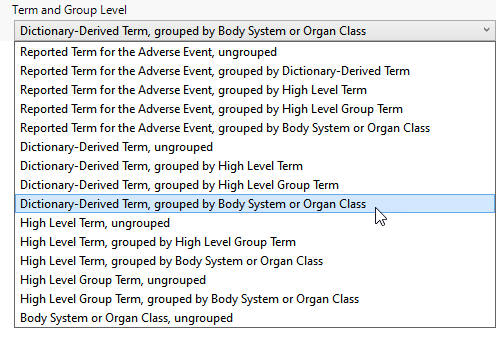
Possible term and group levels are listed in the following table:
|
Term and Group Level |
Corresponding Variable |
Function |
|||
|
Body System or Organ Class |
AEBODSYS in AE |
|
|||
|
High Level Group Term (HLGT) |
AEHLGT in AE |
|
|||
|
High Level Term (HLT) |
AEHLT in AE |
|
|||
|
Dictionary-Derived Term |
AEDECOD in AE |
|
|||
|
Reported Term for the Adverse Event |
AETERM in AE |
|
Time at Risk
View/Hide Details
Use this option to specify how to calculate each subject's duration in patient years.
| • | Patient Years of Exposure is based on treatment start to end of exposure (see details of exposure calculations described for "on treatment events" on the Event Type option). |
| • | Patient Years on Study is based on the start date (RFSTDTC ) to the end of the study trial date (RFENDTC). |
Patient Years Multiplier
View/Hide Details
Use this option to select a multiplier for incidence rates for better interpretability and comparison among studies.
The selection of the incidence rate multiplier may be dependent on the number of subjects in a study and the cumulative time on study/treatment.
For example, a 4 month study of 450 subjects would be equivalent to 150 patient years. If subjects experienced 42 occurrences of a given event (e.g. Headache), then the incidence rate of a headache event would be a rate of 42/150 or .28 per patient years. If the multiplier value 100 is chosen with this option, the incidence rate would be interpreted as .28 * 100 = rate of 28 per 100 patient years.
Determine Time at Risk and Adverse Event Inclusion from:
View/Hide Details
Use this option to specify whether patient years and event inclusion are based on study date variables or from derived patient years/time at risk and event inclusion flags.
Offset (in days) to Include with End Date Variable
View/Hide Details
Use this option to specify the number of days after the last date of study or exposure for calculation of patient time at risk and adverse event variable inclusion.
For example, if you specify 30 days as the offset, 30 days is added to the end date day to calculate risk for experiencing adverse events.
Date for Ongoing Subjects
View/Hide Details
Use this widget to specify an end date for subjects that are continuing in the clinical trial.

Last Modification Date
When the Last Modification Date option is selected, the last modification date/time stamp of the Adverse Events study data set is used as the end date for subjects that are ongoing on a clinical trial and therefore missing values for the Study or Exposure End Date Variable. For example: if RFENDTC is missing in DM for a patient record because that patient is still ongoing on the clinical trial, the date of the last modification to AE or ADAE table in the study data directory is used as the end date value.
Note: If a valid end date variable exists and is populated, the end date value is always used for subjects who have completed the trial and have a valid end date value, regardless of whether this option is checked. The date of the last modification to the AE data table is used only when this option is checked and only for the subjects who do not have a valid end date value. The date of the last modification is used for all subjects only when the end date variable either does not exist or contains no valid end date values.
Specified Below
When the Specified Below option is selected, the following text box appears.

You can either enter the date manually or click  to bring up a calendar window that can be used to specify the desired date.

The date must be in ISO-8601 format. For example, September 1, 2011 must be entered as 2011-09-01.
Include missing Demographic Grouping values
View/Hide Details
Check this option to add a Missing category for any missing values in the demographic grouping variable. If missing values are detected, a Missing section will be added to the graph, and columns for Missing will be added to the tabulate. This option allows for switching between demographic variables such as treatment group, sex, race, and country. When this option is changed, it changes the group displayed on the right y-axis of the bar chart and the grouping variable on the top of the tabulate.
Stack
View/Hide Details
Use this widget to distinguish different levels within each of the adverse events summarized by the bars in the plots.
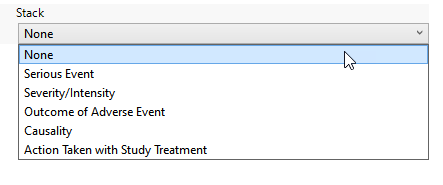
By default, this option is set to None, but can be changed to seriousness, severity, and other adverse event characteristics. When something other than None is selected, the bars in the bar chart will be stacked by the selected variable, and the tabulate will split each demographic grouping column by the stack variable.
Potential options are listed in the following table:
|
Option: |
Select when you want to: |
|
None |
Display all of the occurrences of each adverse event with no indications of levels within each class. |
|
Serious Event |
Display each adverse event bar in two colors: one that represents serious events and one that represents non-serious events. |
|
Toxicity/Severity |
Display each adverse event bar in three colors: one that represents mild events, one that represents severe events, and one that represents moderate events |
|
Outcome of the Adverse Event |
Display each adverse event bar in six colors. Colors represent the following: Recovered/Resolved, Recovered/Resolved with Sequelae, Recovering/Resolving, Not Recovering/Not Resolved, Fatal, and Unknown. |
|
Causality |
Display each adverse event bar in four colors. Colors represent the following events: not related to the treatment, unlikely related to the treatment, possibly related to the treatment, and related to the treatment |
| Action Taken with Study Treatment | Display each adverse event bar in five colors. Colors represent the following events: Dose Not Changed, Not Applicable, Unknown, Dose Modified, and Drug Withdrawn. |
| Period |
This option is displayed only when multiple treatment periods have been detected and displayed. Pretreatment is been assigned to period=0. Displayed counts indicate the number of subjects experiencing an event in each period. Note: This is selected by default when crossover data is detected. |
Note: The options available are dependent on the presence of the relevant variables in the data. For example, Severity is listed only when AESEV is present in the data tables.
Snapshot Records to Include
View/Hide Details
Use this widget to specify which updated snapshot records to include in your analysis. This option is surfaced only in studies where the number of snapshots is greater than 0.
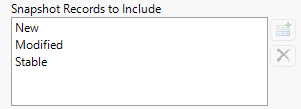
The default state of this option is to show new, modified, and stable - effectively all - snapshot records. To see specific records, you must remove undesired records from the analysis. For example, to surface only the new records, select both Modified and Stable and click  . Click
 to restore deleted records.
Note: JMP Clinical now relies on the JMP Compare Data Tables platform to detect new records. When duplicate rows appear, the platform evaluates them based on their row order. As a result, records are no longer labeled as Non‑Unique or Previously Non‑Unique, and the corresponding options to include those records have been removed.
Additional Filters - Adverse Events
View/Hide Details
The Adverse Events field is an optional parameter that enables you to filter rows from the AE data set to choose the appropriate records to subset to adverse events of interest. Risk indicators are calculated using this subset of adverse events only.

This filter uses JMP WHERE clauses to Select Rows that meet the specified criteria. To use this filter, you must enter the JSL (JMP Scripting Language) expressions that constitute the WHERE clause in the appropriate text box for specific filtering of AEs. Note: This is an advanced concept that not only requires some basic knowledge of the JSL WHERE clause syntax (similar to, but different from, SQL), but also an understanding of the exact variables in the tables in the study.
To filter subjects with a specific event or finding, one could also use the Subpopulation Builder on any domain of interest. For example, filter to all subjects that exhibit cardiac failure ( :Customized Query 01 Name == "Cardiac failure" ) and run all reports on those.
To specify an Adverse Events filter:
| 8 | Click  to open the WHERE Clause Builder to construct the desired filter. |
| 8 | Click  to clear the filter. |
Report Data Filters
View/Hide Details
The report filter limits the bar chart and the tabulate to only those records that meet the filter selection. For example, if the lower bound of the Overall Percent Occurrence is set to 5, then only adverse events occurring in at least 5% of all subjects will be displayed. The filter builds upon itself, so if Serious Event equals Y and Outcome of Event equals Fatal are both selected, then only serious events that were fatal will be displayed.
Refer to Data Filter for more information.
Note: Filter specifications are reapplied when any widget options are changed.
Action Buttons
Action buttons provide you with an easy way to drill down into your data. The following action buttons are generated by this report:
View/Hide Details
| • | Click  to rerun the report using default settings. |
| • | Click  to view the associated data tables. Refer to Show Tables for more information. |
| • | Click  to generate a standardized PDF- or RTF-formatted report that contains the plots and charts of selected sections. |
| • | Click  to generate a JMP Live report. Refer to Create Live Report for more information. |
| • | Click  to take notes and store them in a central location. Refer to Add Notes for more information. |
| • | Click  to read user-generated notes. Refer to View Notes for more information. |
| • | Select one or more subjects and then click  to apply the Review Subject Filter and filter all reports in the review builder on the selected subjects. |
| • | Select a group of subjects and click  to specify Derived Population Flags that enable you to distinguish the selected group of subjects from the general population. |
Default Settings
Refer to Set Study Preferences for default Subject Level settings.