Findings Rating Scales
Categorical endpoints are frequently summarized in clinical trials and are often included within the Questionnaires (QS) domain, where patients choose from a limited number of predefined responses to specific survey questions. However, categorical endpoints are not exclusive to the QS domain and might be included in other domains to summarize endpoints with a limited number of levels, such as rating scales. For example, subjective endpoints that describe patient-reported symptoms might be reported using a scale with the following character and corresponding numeric values:
| • | None (0) |
| • | Mild (1) |
| • | Moderate (2) |
| • | Severe (3) |
| • | Very Severe (4) |
Similar scales might be used by physicians to describe the overall severity of various aspects of a disease. Other possibilities include scales that describe the level of agreement to particular statements:
| • | Strongly Disagree (-2) |
| • | Disagree (-1) |
| • | Neutral (0) |
| • | Agree (1) |
| • | Strongly Agree (2) |
or binary outcomes that describe whether an endpoint was successful:
| • | Failure (0) |
| • | Success (1) |
The new Findings Rating Scales report analyzes endpoints from findings domains with a limited number of levelsand presents results by Visit. In general, tests can be analyzed when they have both character values (even when those values are numeric) and corresponding numeric values, similar to the scales presented above.
Methodology
Outcome is a method for evaluating change in a test from the Baseline visit to a non-Baseline visit using a three-level endpoint that answers the question “Did values decrease, increase, or remain the same?”. Our scale here is:
| • | None (0) |
| • | Mild (1) |
| • | Moderate (2) |
| • | Severe (3) |
| • | Very Severe (4) |
The report requirement for the corresponding numeric values makes it possible to calculate the number of levels changed. Some simple examples are provided for illustration:
| • | A patient who improves from Severe (3) at Baseline to None (0) at Week 4 Decreases by 3 levels, because 0 – 3 = 3. |
| • | A patient who worsens from Moderate (2) at Baseline to Very Severe (4) at Week 4 Increases by 2 levels, because 4 – 2 = 2. |
| • | A patient who is Moderate (2) at Baseline and Moderate (2) at Week 4 experiences no change and has a Neutral response, because 2 – 2 = 0. |
One final note about Outcome and the Achieving a minimum or maximum value meets outcome criteria option before reviewing the output. Selecting this option requires that the Minimum and Maximum values of each scale be known. JMP Clinical attempts to derive these values for each test based on the observed values in the selected Domain. However, it is entirely possible that the true Minimum and Maximum values might not be observed during the clinical trial. Users can review and modify these values, if necessary, before performing the analysis. This is described below.
Usage and Interpretation
In general, results are presented by Visit for a single endpoint at a time. If the Time point is available, results are presented by Visit and Time point for a single endpoint. The Data Filter is used to select different endpoints and Time points for review.
A limited artificial example with the single symptom Foreign Body Sensation (FBS) is used here to describe the report and output (measured with None, Mild, Moderate, Severe, Very Severe).
Note: Click on the figures below to enlarge.
Example: 50 patients were randomized to one of three treatments (High Dose, Low Dose, and Placebo) across four Visits (Baseline, Week 2, Week 4, and Week 6).
 View/Hide Details
The output consists of three figures.
Stacked Bar Charts Across Visits
Figure 1 summarizes the observed values for each test across study visits using a stacked Bar Chart with annotations showing either the number of patients or percentages, depending on the Display option.
Figure 1: Stacked Bar Charts Across Visits
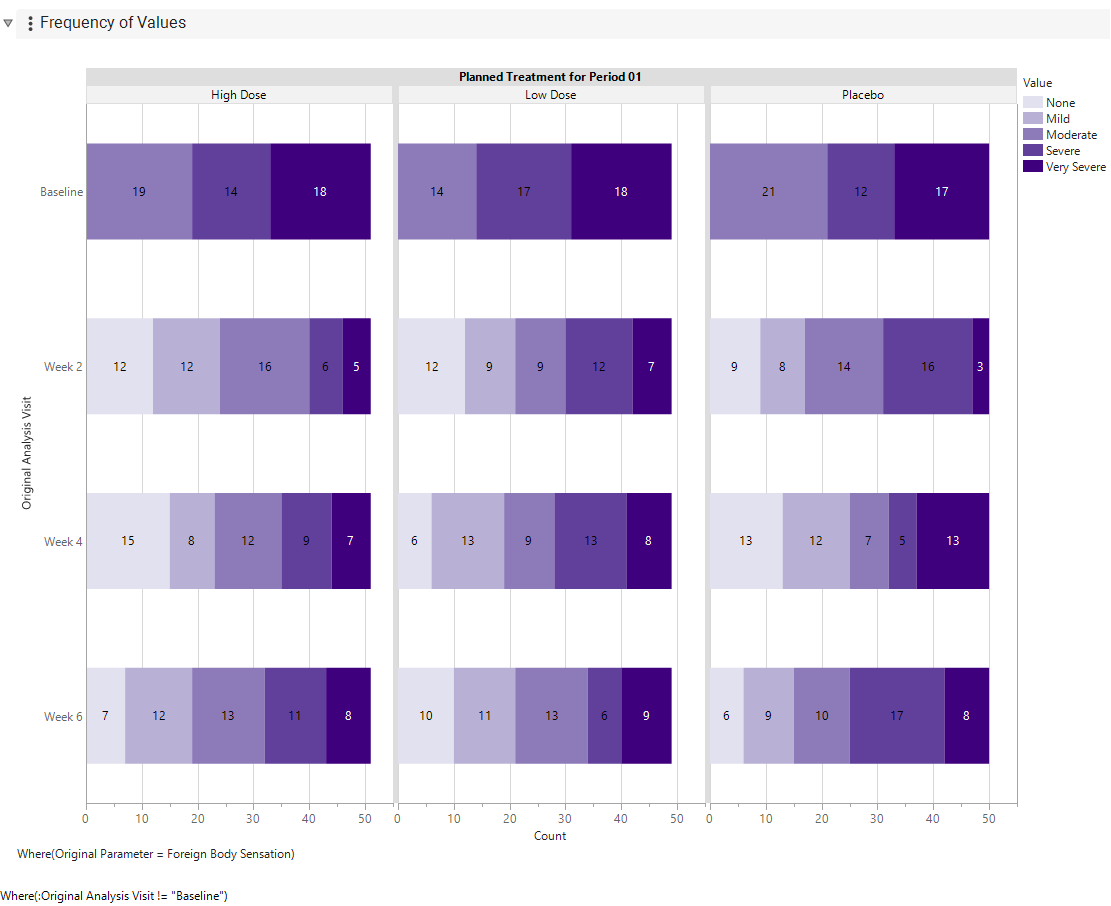
This display makes it straightforward to assess change across visits within each Treatment level. Choosing Y-Axis = Treatment switches Visit and Treatment on the y- and x-axes, making it easier to compare the test across Treatments within each Visit level. Darker shades of blue indicate greater symptom severity. Note that all patients have at least Moderate severity at Baseline.
Categorical Shift Plot
Figure 2 shows a categorical shift plot with Display = Percent. These percentages are relative to Baseline values, which are presented on the y-axis and nested within Visit. On-study values are presented along the x-axis.
Figure 2: Categorical Shift Plot Displayed in Percents
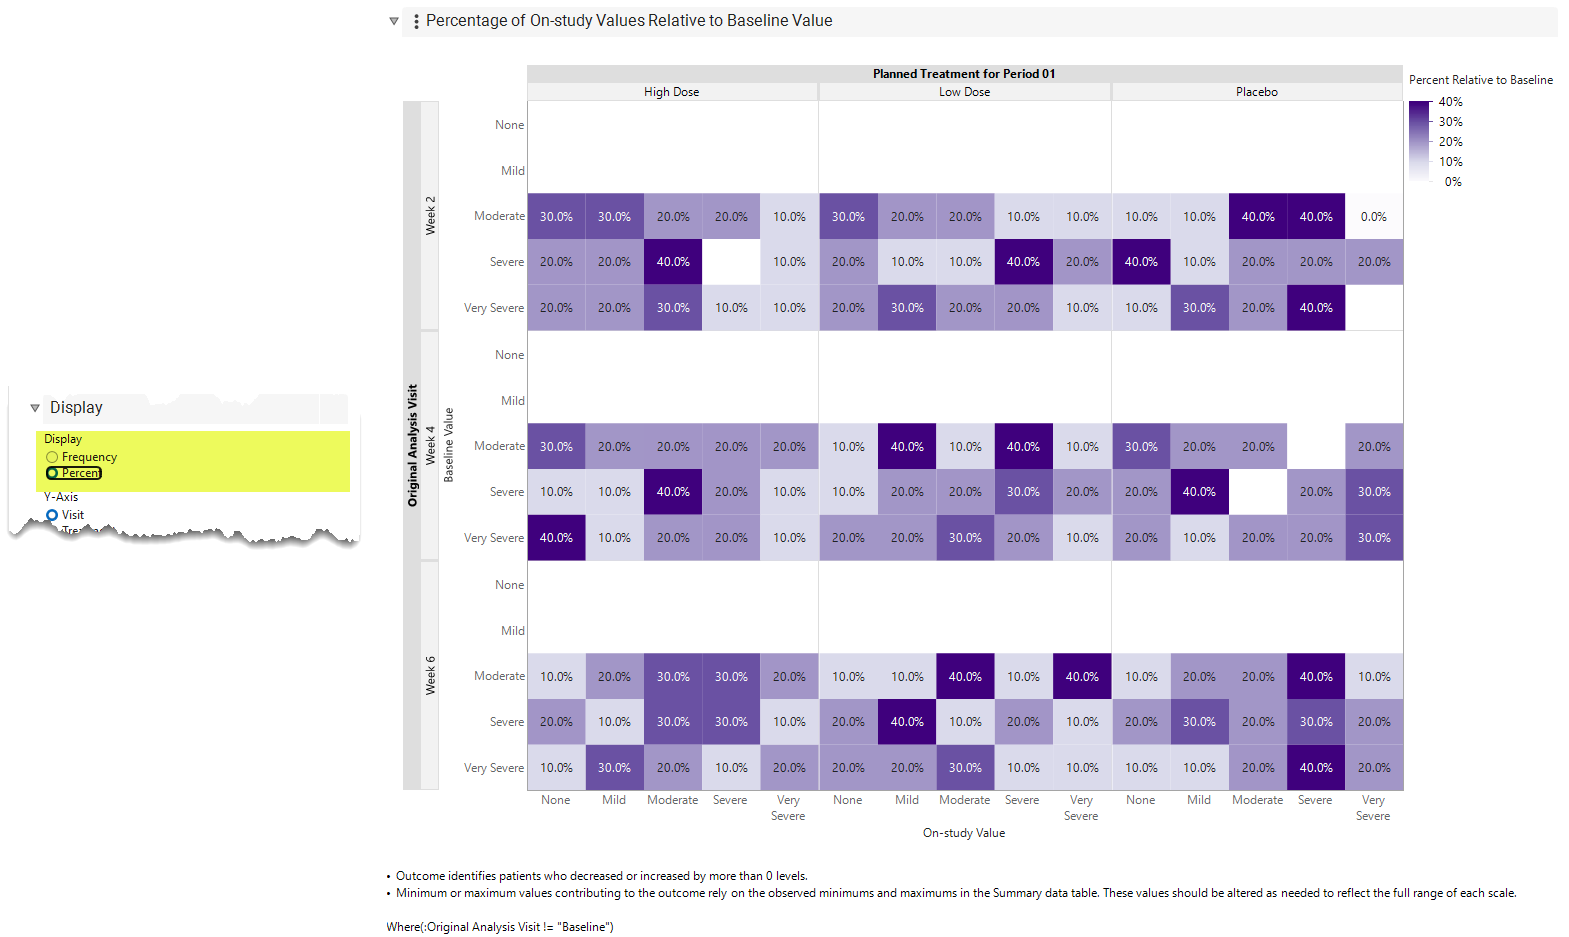
For example, for patients in the top-most High Dose row who were Moderate at Baseline, the following conclusions can be drawn at Week 2:
1. 30.0% improved to None
2. 30.0% improved to Mild
3. 20.0% stayed Moderate
4. 20.0% worsened to Severe
5. 10.0% worsened to Very Severe
For patients in the bottom-most High Dose row who were Very Severe at Baseline, the following conclusions can be drawn for Week 2:
1. 40.0% improved to None
2. 10.0% improved to Mild
3. 20.0% improved to Moderate
4. 20.0% improved to Severe
5. 10.0% stayed Very Severe
The color represents the frequency or percentage of patients within each cell, with darker shades indicating larger values. Color intensity can be used to easily identify cells with high frequencies or percentages. It is recommended that these tables be interpreted using both Frequency and Percentage.
Outcome
Figure 3 displays a stacked bar chart for Outcome with Display = Percent. The Achieving a minimum or maximum value meets outcome criteria is not selected.
Figure 3: Stacked Bar for Outcome without Minimums and Maximums
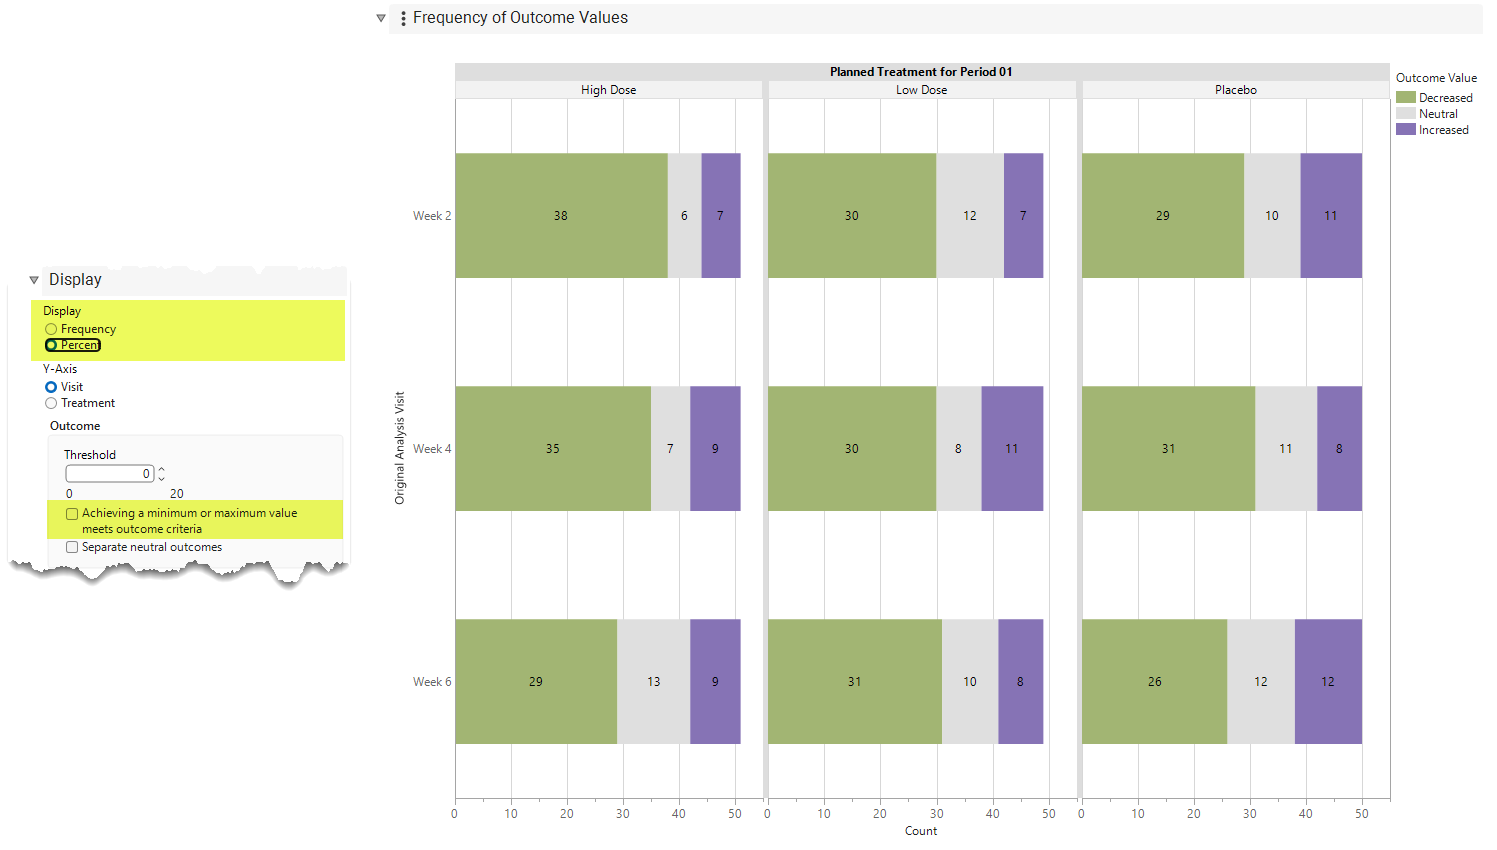
For High Dose, the following conclusions can be drawn for patients at Week 2:
1. 74.5% Decreased, meaning that severity improved by one or more levels from Baseline.
2. 13.7% Increased, meaning that severity worsened by one or more levels from Baseline.
3. 11.8% of patients had a Neutral response, which, with Threshold = 0, means that their value did not change from Baseline.
Changing Threshold = 1 updates the plot to Figure 6.
Figure 4: Stacked Bar Chart for Outcome with Threshold = 1
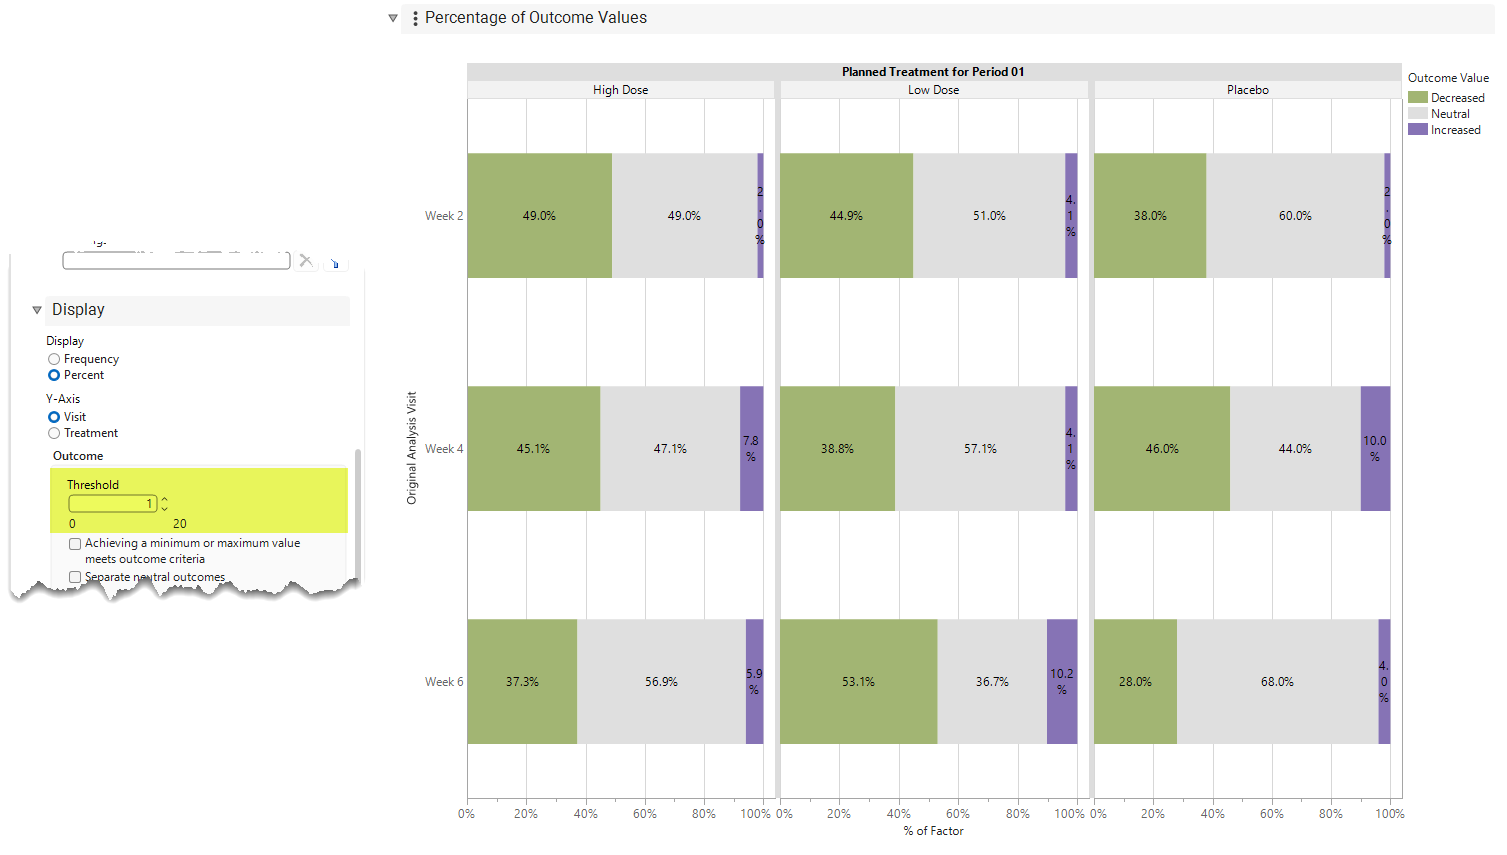
For High Dose, the following conclusions can be drawn for patients at Week 2:
1. 49.0% Decreased, meaning that severity improved by two or more levels from Baseline.
2. 2.0% Increased, meaning that severity worsened by two or more levels from Baseline.
3. 49.0% of patients had a Neutral response, which, with Threshold = 1, means that their value either did not change from Baseline or only decreased or increased by a single level.
Selecting Achieving a minimum or maximum value meets outcome criteria for this example produces Figure 5.
Figure 5: Stacked Bar Chart for Outcome Including Minimums and Maximums with Threshold = 1
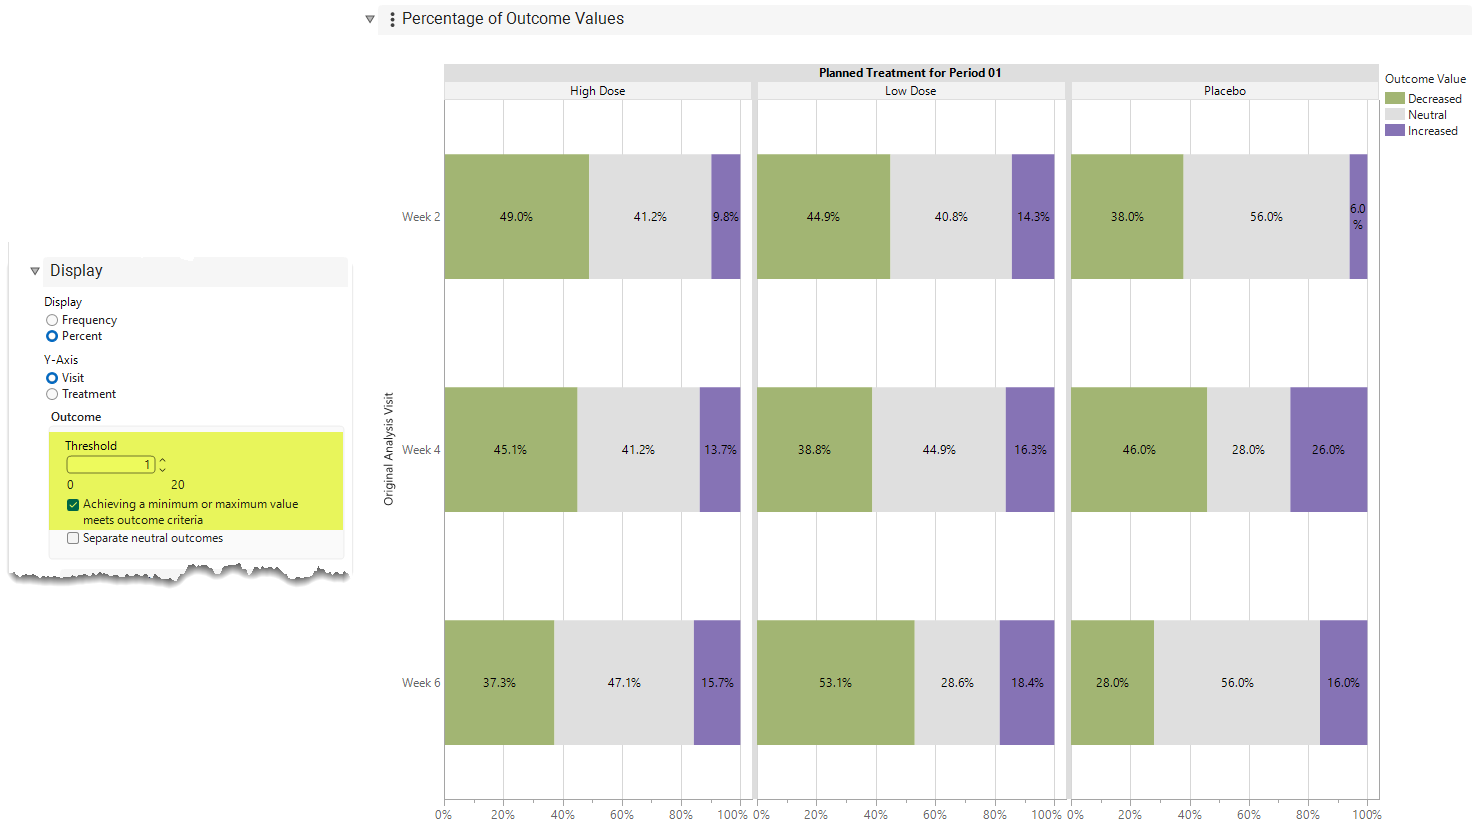
For High Dose, the following conclusions can be drawn for patients at Week 2:
1. 49.0% Decreased, meaning that severity improved by two or more levels from Baseline and/or the Patient had the Minimum value of 0.
2. 9.8% Increased, meaning that severity worsened by two or more levels from Baseline and/or the Patient had the Maximum value of 4.
3. 41.2% of patients had a Neutral response, which, with Threshold = 1 and Minimums and Maximums included, means that their value either did not change from Baseline or only decreased or increased by one level and were not at the Minimum/Maximum.
How should the results between Figures 4 and 5 be interpreted? In situations in which the goal is to identify patients who are experiencing particularly bad outcomes (for example), Figure 4 identifies only patients for whom a twolevel worsening is possible. For example, patients who worsen from Moderate to Very Severe are identified (2% of patients). However, Severe patients who worsen from Severe to Very Severe are not identified because they worsen by only one level, even though they reach the worst level on the scale. Likewise) patients who are Very Severe at Baseline are not identified because they are already at the worst level and cannot worsen any further. In Figure 5, the latter two types of patients are included in the Outcome. Additional patients meet the Outcome criteria because they reach the Maximum value despite worsening by only one level or not changing. The Achieving a minimum or maximum value meets outcome criteria option enables users to modify the Outcome toaddress the specific analysis objective.
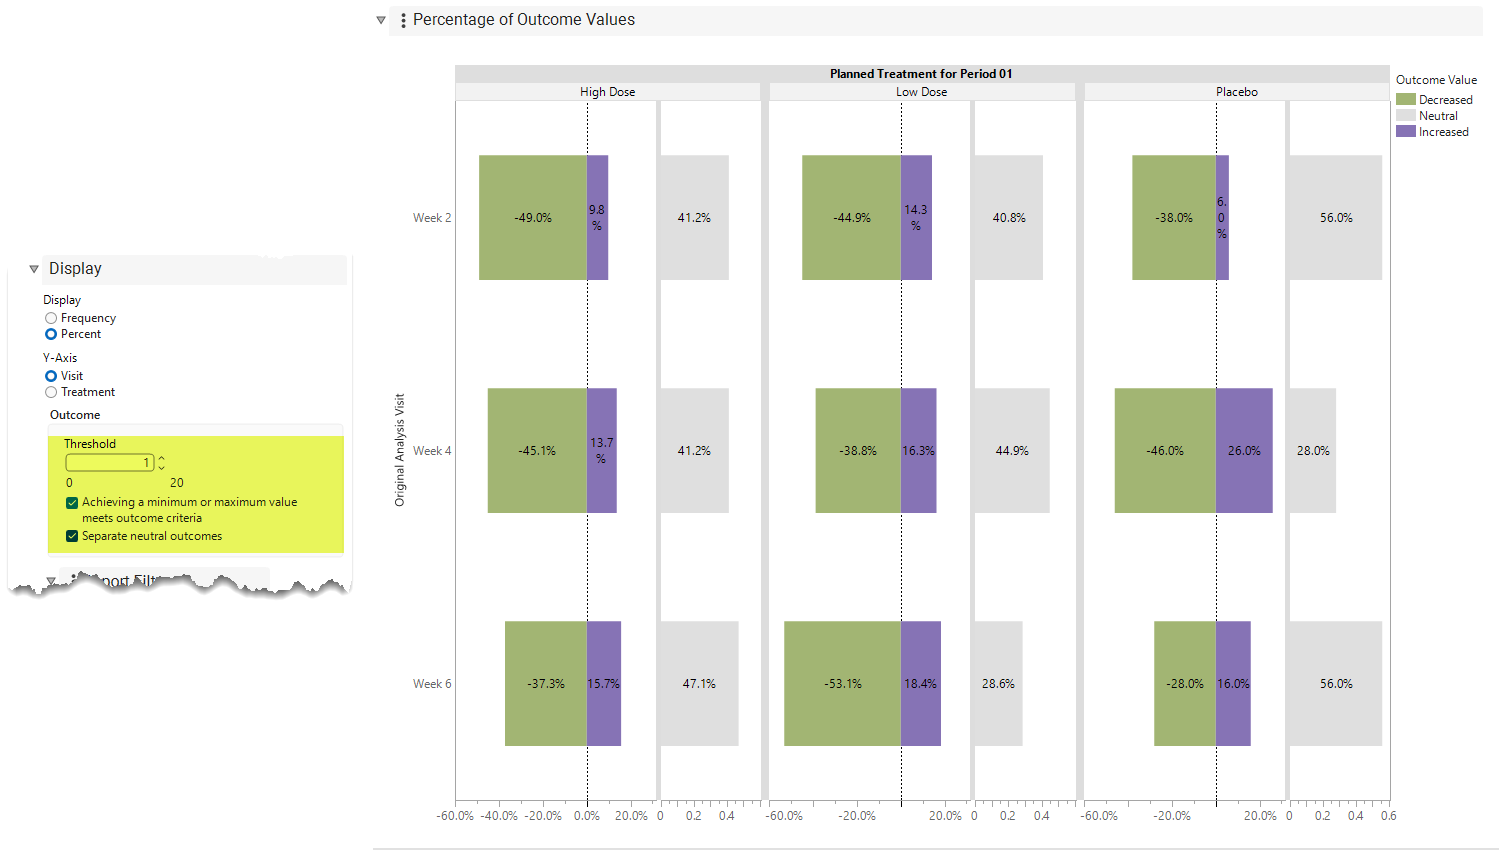
For completeness, selecting Separate neutral outcomes produces Figure 6. The content is identical to that of Figure 5; however, it makes it much easier to assess changes in the frequencies or percentages for Decreased, Increased, and Neutral outcomes across Visit levels within Treatment levels. Selecting Y Axis: Treatment makes it easier to compare Treatments within Visit levels(not shown).
Figure 6: Separating Neutral Outcomes
Finally, returning to a point discussed above regarding the inclusion of Minimums and Maximums in the definition of Outcome, the Summary data table (available through Show Tables) provides a single location for all derived summary statistics used in the Outcome analysis.
Figure 7: Derived Minimums and Maximums
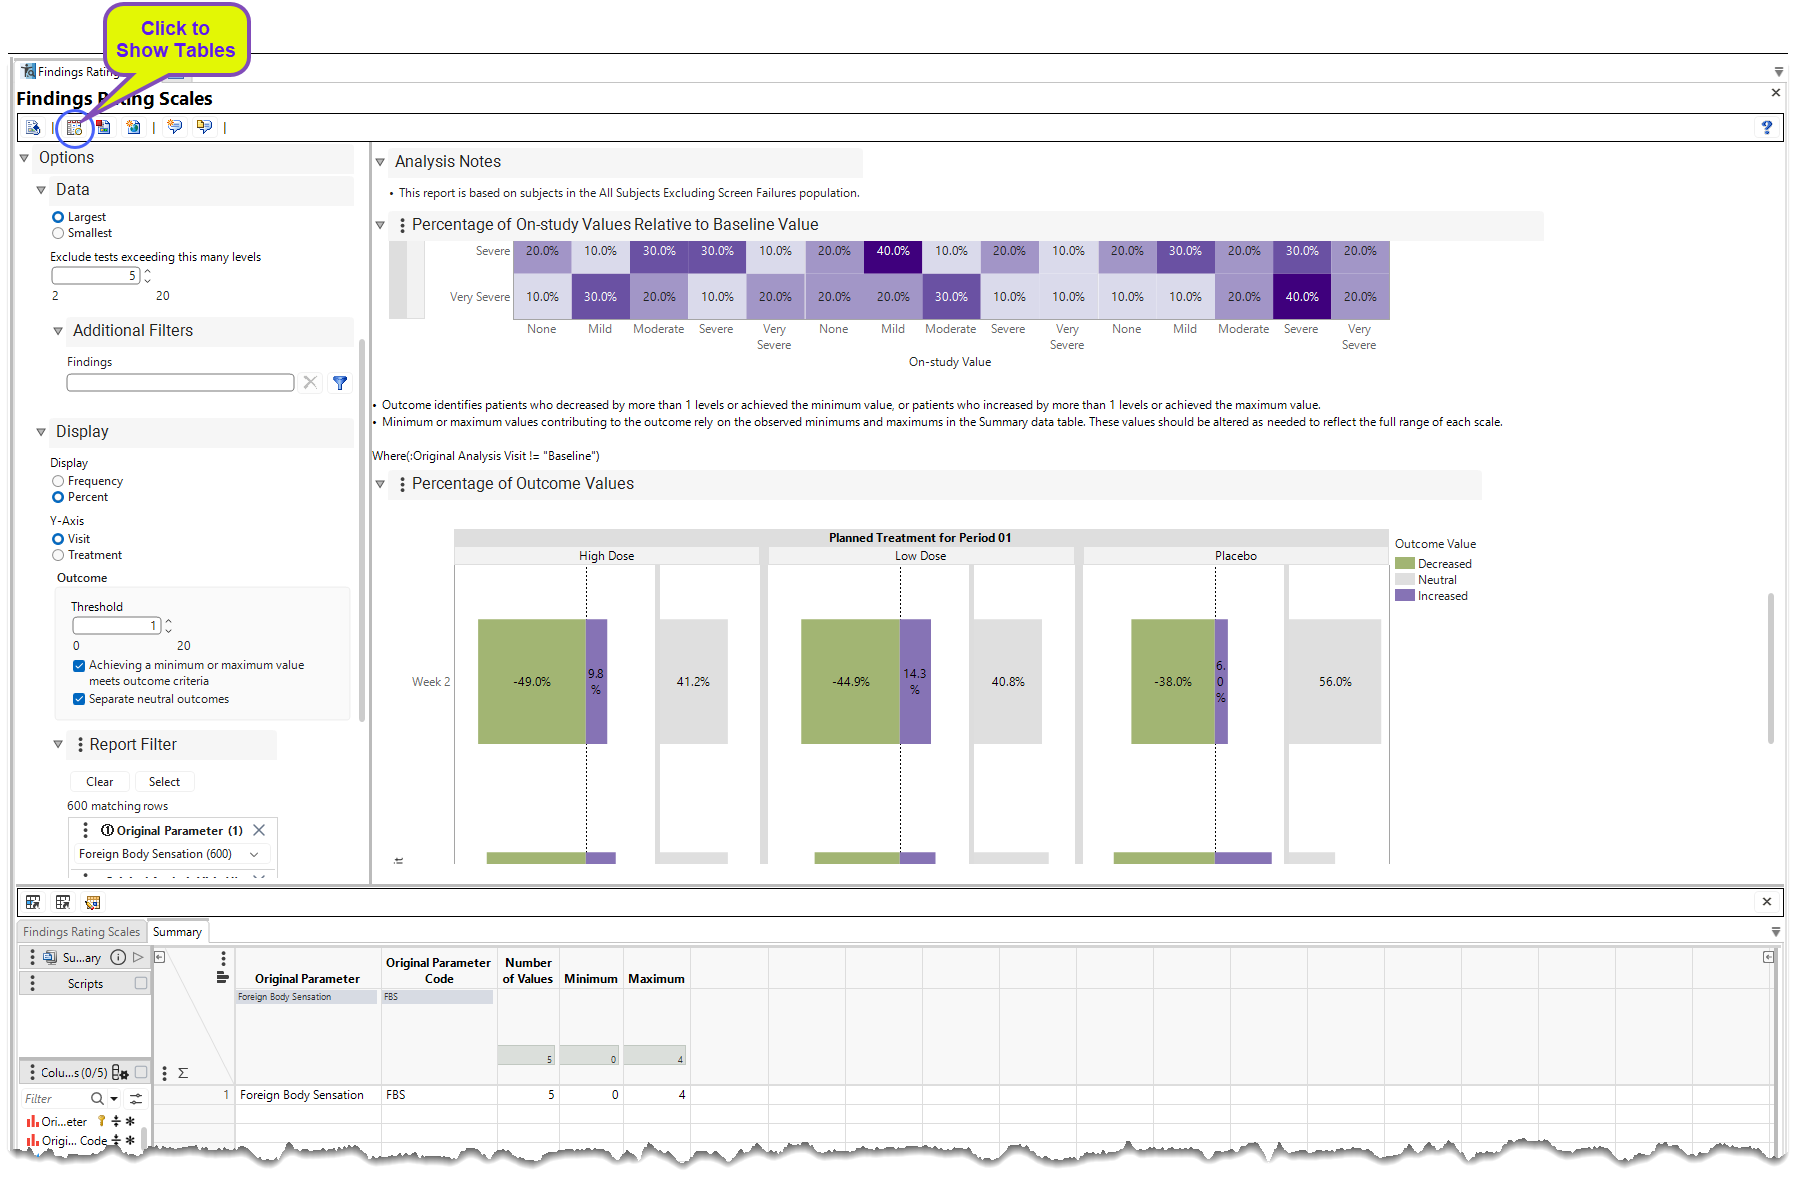
The values presented show that the Minimum and Maximum values were correctly derived as 0 and 4, respectively (based on the severity scale above). However, what if the severity scale had an additional level that was not observed in the data?
1. None (0)
2. Mild (1)
3. Moderate (2)
4. Severe (3)
5. Very Severe (4)
6. Exceptionally Severe (5)
In this case, to appropriately compute Outcome when Achieving a minimum or maximum value meets outcome criteria is selected, change the Maximum value in Summary from 4 to 5. This change recomputes the endpoint using the appropriate Maximum value.
Options
Data
Autorun this Report
View/Hide Details
Unlike most JMP Clinical reports, this report does not run automatically when launched. To have it run automatically, select the Auto-run this report check box. Otherwise, click whenever you want to run it.
Domain
View/Hide Details
Use this widget to select a specific study Domain.
Findings Tests
View/Hide Details.
Use this widget to select specific Findings tests. If you leave this field blank, all tests are run.
| 8 | Click  to open the Add window (shown below) that lists available test names (shown below). |
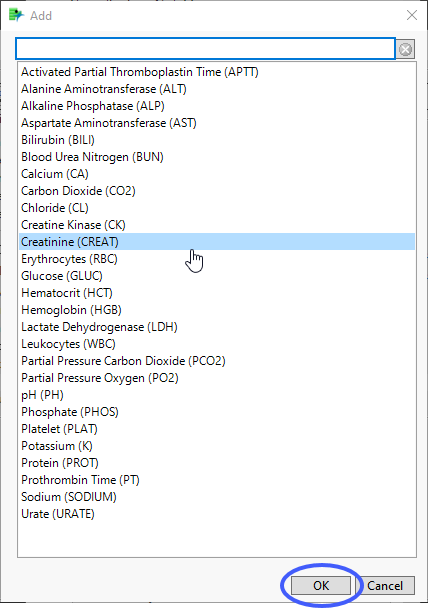
| 8 | Select the desired test(s) and click to add them to the text box. |
Remove Unscheduled visits
View/Hide Details.
You might want to include unscheduled visits when you are analyzing findings by visit.
By default, this box is checked. When it is checked, records are excluded from the analysis if the VISIT variable exists and contains the text "unscheduled" for those records. If the box is not checked, all records are included regardless of the VISIT status.
For some reports, you might have to specify Visits as the Time Scale to enable this field.
Calculate baseline using
View/Hide Details.
Use this widget to use the flagged baseline record, last recorded pre-dose measurement, or the mean of all the measurements taken during the baseline time window as the baseline measurement.
By default, the flagged baseline record is used.
The following test measurements are considered when forming the baseline measurement:
| • | Those flagged as baseline |
| • | Those taken prior to Study Day 1 |
Choose Last recorded pre-dose measurement to use the last recorded predose test measurement (out of the test measurement pool generated from the above list) as the baseline measurement.
Choose Mean of recorded pre-dose measurements to average these predose test measurements to form the baseline measurement.
Note: When the selected option to calculate baseline is to use the baseline flag and there are two records flagged as baseline, JMP Clinical uses the last record. This differs from JMP Clinical version 8.1, where the mean of the flagged baseline values was used.
Among duplicates, select observations where the numeric value is
View/Hide Details
Selecting this option allows for a single measurement to be selected at each Visit for each patient. For example, if a patient was scored as being Moderate (2) and Severe (3) at Visit 5, the default option of Largest implies that the Severe value will be used in the analysis.
Select Largest to use the largest of 2 or more measurements in the analysis.
Select Smallest to use the smallest of 2 or more measurements in the analysis.
Exclude tests exceeding this many levels
View/Hide Details
Use this option to o limit the analysis to tests that have a limited number of levels
By default, this option is set to 5 levels.
Display
Display
View/Hide Details
Use this option to specify how you want to present the results of your analysis.
Choose Frequency to show the number of patients experiencing a particular level.
Choose Percent to show the percentage of patients for a particular Treatment and Visit experiencing a particular level. For the categorical shift plot, these percentages are relative to the Baseline value.
Y-Axis
View/Hide Details
Use this option to specify the orientation of the Bar chart.
Choose Visitto summarize visits on the y-axis and treatments on the x-axis of the plots.
Choose Treatmentto summarize treatments on the y-axis and visits on the x-axis of the plots.
Threshold
View/Hide Details
Identifies patients who Decreased or Increased by more than this number of levels. By default, Threshold = 0 meaning that patients who decrease by more than 0 levels are classified as Decreased, patients who increase by more than 0 levels are classified as Increased, and patients who experienced no change are classified as Neutral. If Threshold = 1, patients who decrease by more than 1 level are classified as Decreased, patients who increase by more than 1 level are classified as Increased, and patients who experienced change of 1 or fewer levels are classified as Neutral. The example above evaluates whether a change of at least 2 levels occurred and, if so, its direction.
Achieving a minimum or maximum value meets outcome criteria
View/Hide Details
This includes whether the patient achieved the Minimum or Maximum value of a scale in determining the response to the Outcome. Here, Outcome identifies patients who Decreased by more than Threshold levels or achieved the Minimum value, or patients who Increased by more than Threshold levels or achieved the Maximum value. Otherwise, patients are Neutral.
Separate neutral outcomes
View/Hide Details
Checking this option separates out the neutral outcomes to more easily compare patients who decreased or increased over time.
Report Filter
View/Hide Details
The report filter limits the bar chart and the tabulate to only those records that meet the filter selection. .
Refer to Data Filter for more information.
Note: Filter specifications are reapplied when any widget options are changed.
Action Buttons
Action buttons provide an easy way for you to drill down into your data. The following action buttons are generated by this report:
Click here to display the list and description of the Report Action buttons.
| • | Click  to rerun the report using default settings. |
| • | Click  to view the associated data tables. Refer to Show Tables for more information. |
| • | Click  to generate a standardized PDF- or RTF-formatted report containing the plots and charts of selected sections. |
| • | Click  to generate a JMP Live report. Refer to Create Live Report for more information. |
| • | Click  to take notes, and store them in a central location. Refer to Add Notes for more information. |
| • | Click  to read user-generated notes. Refer to View Notes for more information. |
Default Settings
Refer to Set Study Preferences for default Subject Level settings.