Nearby Occurrences
The Nearby Occurrences report allows users to define reference occurrences of interest and find nearby occurrences either according to time windows around start or stop dates, or whether there is any overlap in time between reference and nearby occurrences. This report considers occurrences such as adverse events (AE) from the AE domain, concomitant medications (CM) from the CM domain, or deaths based on the presence of a death date in either DM or ADSL.
Nearby Occurrences allows users to:
| • | Identify medications that were started on or within a few days subsequent to the start date of any AEs of interest. |
| • | Identify AEs or medications that started within a week prior to a patient’s death. |
| • | Identify any AEs that start within a few days of stopping particular medications. |
| • | Identify any AEs that start or are ongoing while particular medications are used. |
Report Results Description
Running Nearby Occurrences for Nicardipine using default settings generates the report shown below. Output from the report is organized into sections. Each section contains one or more plots, data panels, data filters, or other elements that facilitate your analysis.
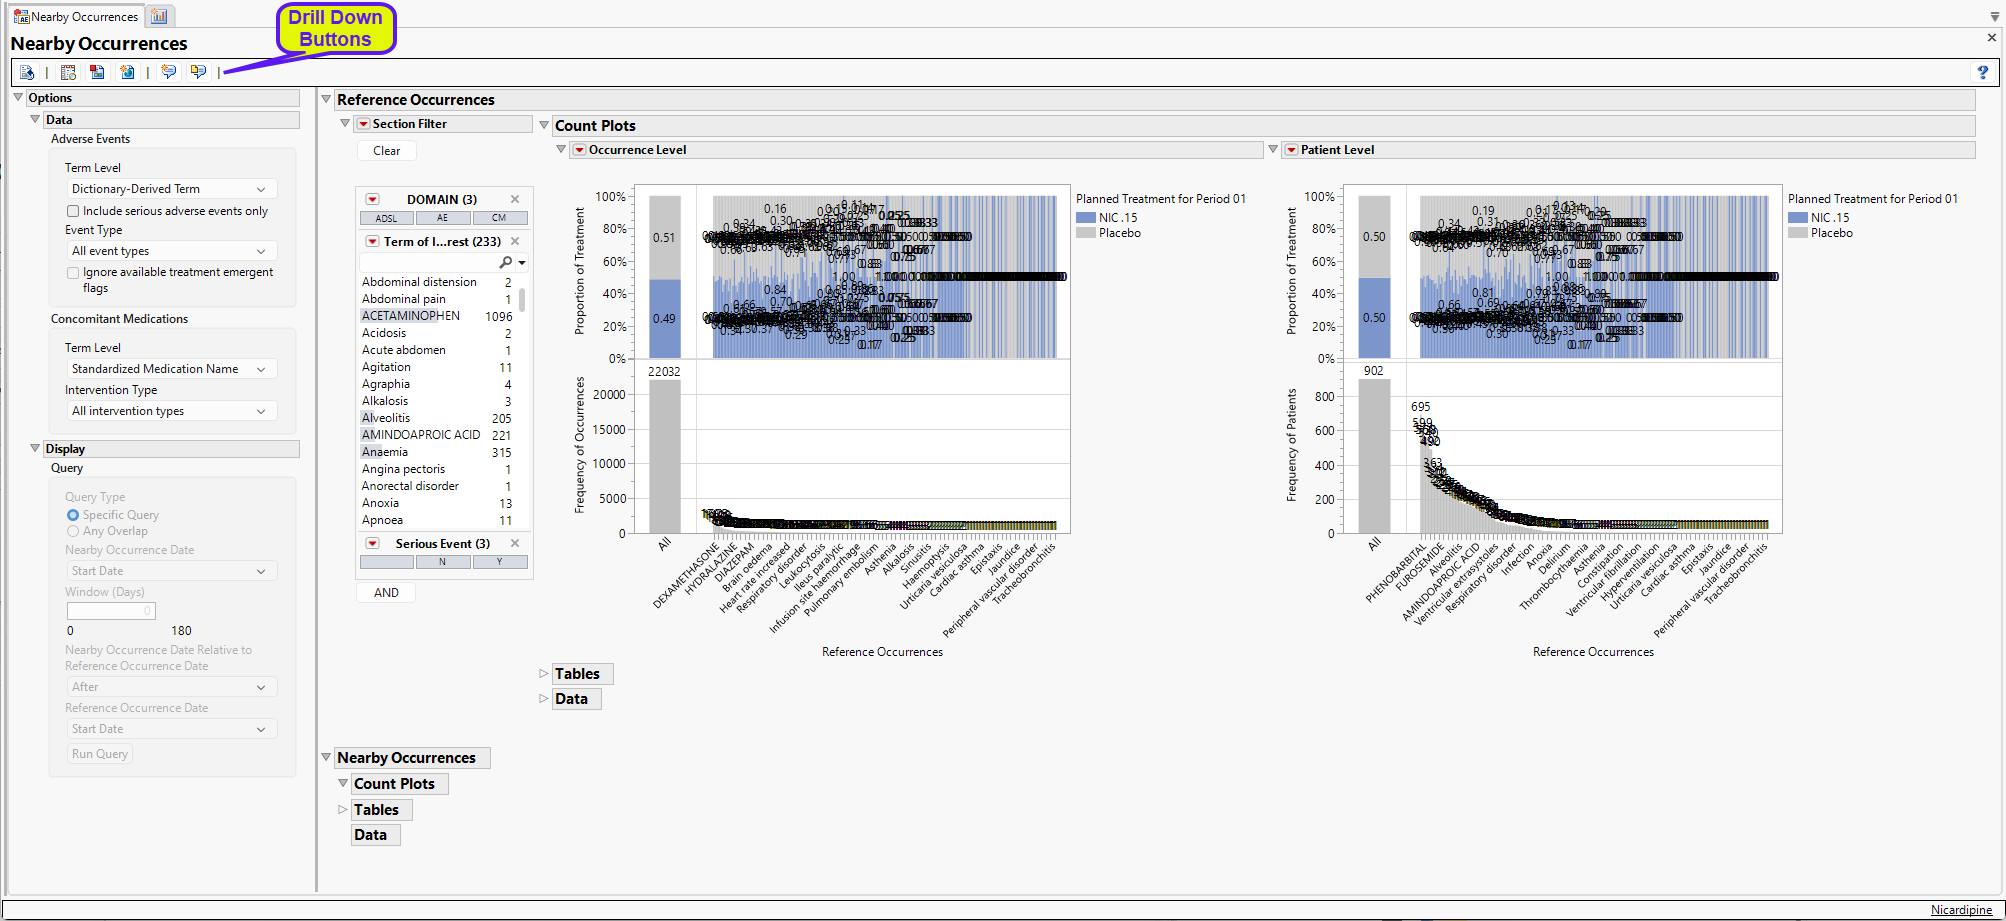
The work the report has conducted so far is to combine the AE, CM, and death data (as records) into a single data table and define the Term of Interest according to the dialog selections (the Term of Interest for deaths is “Death”). All occurrences are displayed on the Reference Count Plots. There are too many for us to evaluate objectively, so we need to focus on a few at a time.
Suppose we are interested in Serious Adverse Events (SAEs) that are from the MedDRA High Level Group Term (HLGT) cardiac arrhythmias. To do this we need to use the section filter. Refer to Data Filter for more information on the section filter.
In the Section Filter:
| 8 | Click the AE domain. |
| 8 | In the Terms of Interest box, press and hold the CTRL key and select Atrial fibrillation, Atrioventricular block first degree, Cardiac arrest, Supraventricular tachycardia, Ventricular extrasystoles, Ventricular fibrillation, and Ventricular tachycardia. |
| 8 | Click Y in the Serious Event box. |
With each selection, the plots change. The final plots are shown below. We use these selections for the rest of this example.
Reference Occurrences
This section includes two count plots and the associated tables, shown below.
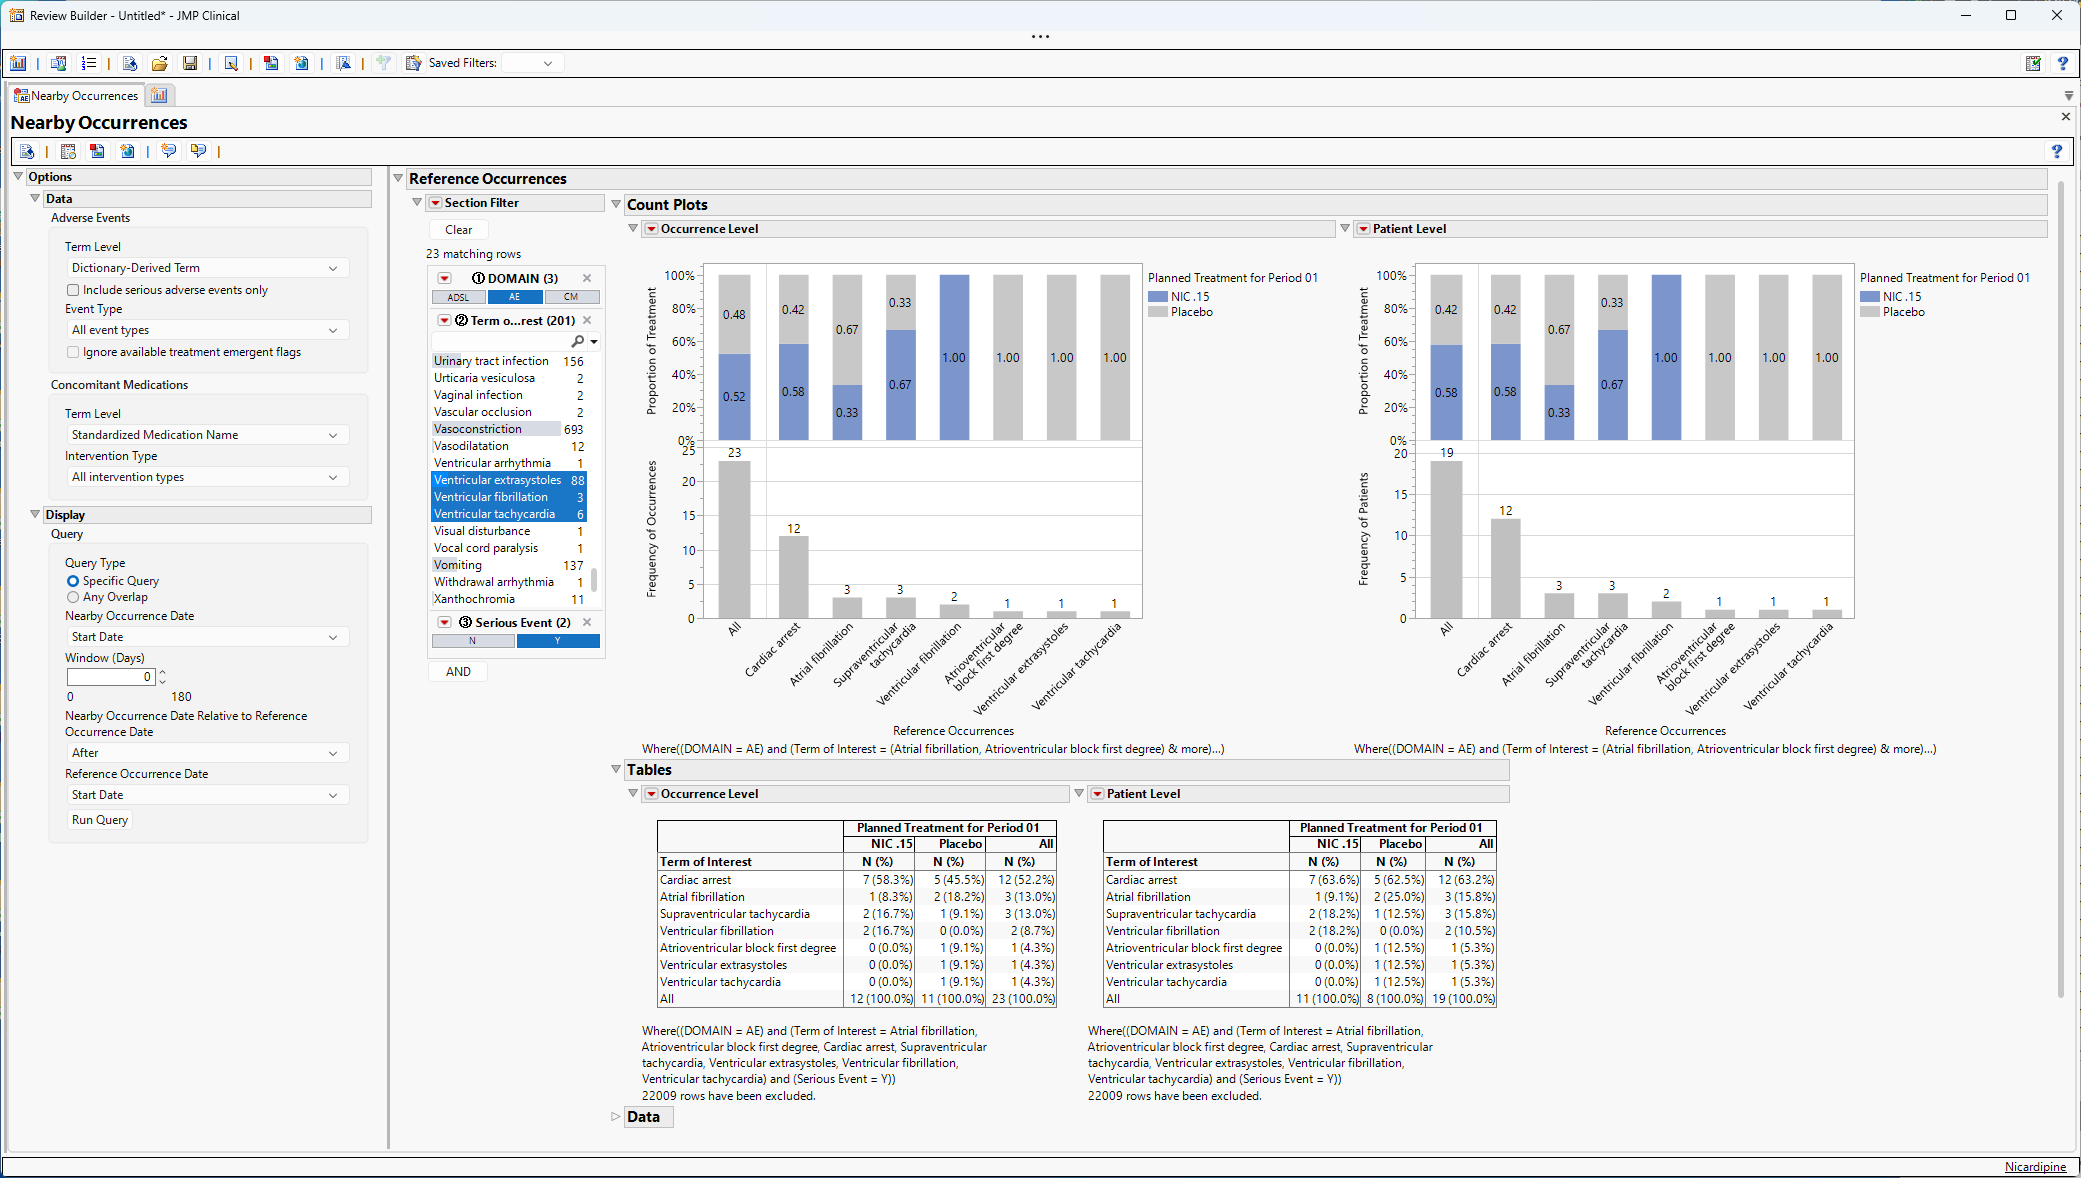
Note the selections in the section filter.
From the left Count Plot at the occurrence level, we can ascertain the following:
| • | There are 23 reference occurrences that are SAEs from the HLGT cardiac arrhythmias. Of these 23 occurrences, 52% and 48% of these events take place in patients in the NIC .15 and Placebo arms, respectively. |
| • | The most commonly occurring event is cardiac arrest with 12 occurrences, 58% and 42% in NIC .15 and Placebo, respectively. |
| • | The least common SAE cardiac arrhythmias are atrioventricular block first degree, ventricular extrasystoles, and ventricular tachycardia with 1 occurrence each which occurred in patients in the placebo arm. |
From the right Count Plot at the patient level, we can ascertain the following:
| • | There were 19 patients that experienced cardiac arrhythmia SAEs. Of these 19 patients, 58% and 42% are in the NIC .15 and Placebo arms, respectively. |
| • | The frequencies of patients for each occurrence type (n = 12, 3, 3, 2, 1, 1, 1) do not change from the occurrence level Count Plot, indicating that each occurrence type occurs in a different patient. Had the frequencies been higher for an occurrence type in the occurrence level plot, that would have indicated that patients would have experienced more than one instance of an occurrence. |
| • | The sum of the frequencies of the individual occurrences (12 + 3 + 3 + 2 + 1 + 1 + 1 = 23) is greater than the number of patients (n = 19), indicating that some patients experienced multiple cardiac arrhythmia SAEs. |
Tabular summaries are provided that show the frequency and column percentage of each occurrence. For example, from the tables we can conclude that:
| • | 52.2% (12/23) of the cardiac arrhythmia SAE occurrences across both arms were cardiac arrest. |
| • | 63.2% (12/19) of the patients with at least one cardiac arrhythmia SAE occurrence experienced a cardiac arrest. |
The 23 reference occurrences are available for review by opening the Data outline box (not shown).
Nearby Occurrences
Up until this point, there is no output in the Nearby Occurrences section. To generate output, we need to run a specific query. With the selection of these reference occurrences, the Query outline box of the Display options panel is enabled, allowing the user to run a query to identify events (AEs or deaths) or medications that meet the criteria of the query. Two types of queries are possible:
| • | Specific Query |
This query will search for nearby occurrences by comparing the Start/Stop date of the reference occurrences to the Start/Stop of the nearby occurrences. If the nearby occurrences occur within the selected number of days after, before, or before or after the selected dates, they will be summarized in the Nearby Occurrences area of the output. Note that a window of 0 days will identify occurrences that occur on the same date. For example, if start date is used for both reference and nearby occurrences, Nearby Occurrences will identify terms that start on the same day as reference occurrences. In these cases, the relative relationship between the dates will have no practical difference on the query.
| • | Any Overlap |
This query will search for nearby occurrences by assessing whether there is any overlap in time based on the start and end dates of the reference and nearby occurrences.
Example of a Specific Query
In this example, we run the following query to identify nearby occurrences that start within 3 days before the start of the reference occurrences.
| 8 | Use the drop-down to set Window (Days) option to 3. |
| 8 | Use the drop-down to set the Nearby Occurrence Date Relative to Reference Occurrence Date option to Before. |
All other query settings remain as default settings.
| 8 | Click Run Query. |
Clicking Run Query will produce figures and tables in the Nearby Occurrences area of the output window (shown below). You can close the Reference Occurrences outline box to easily view this output.
The initial output is extremely crowded, though when we subset to CM using the Section Filter, we get the results shown below:
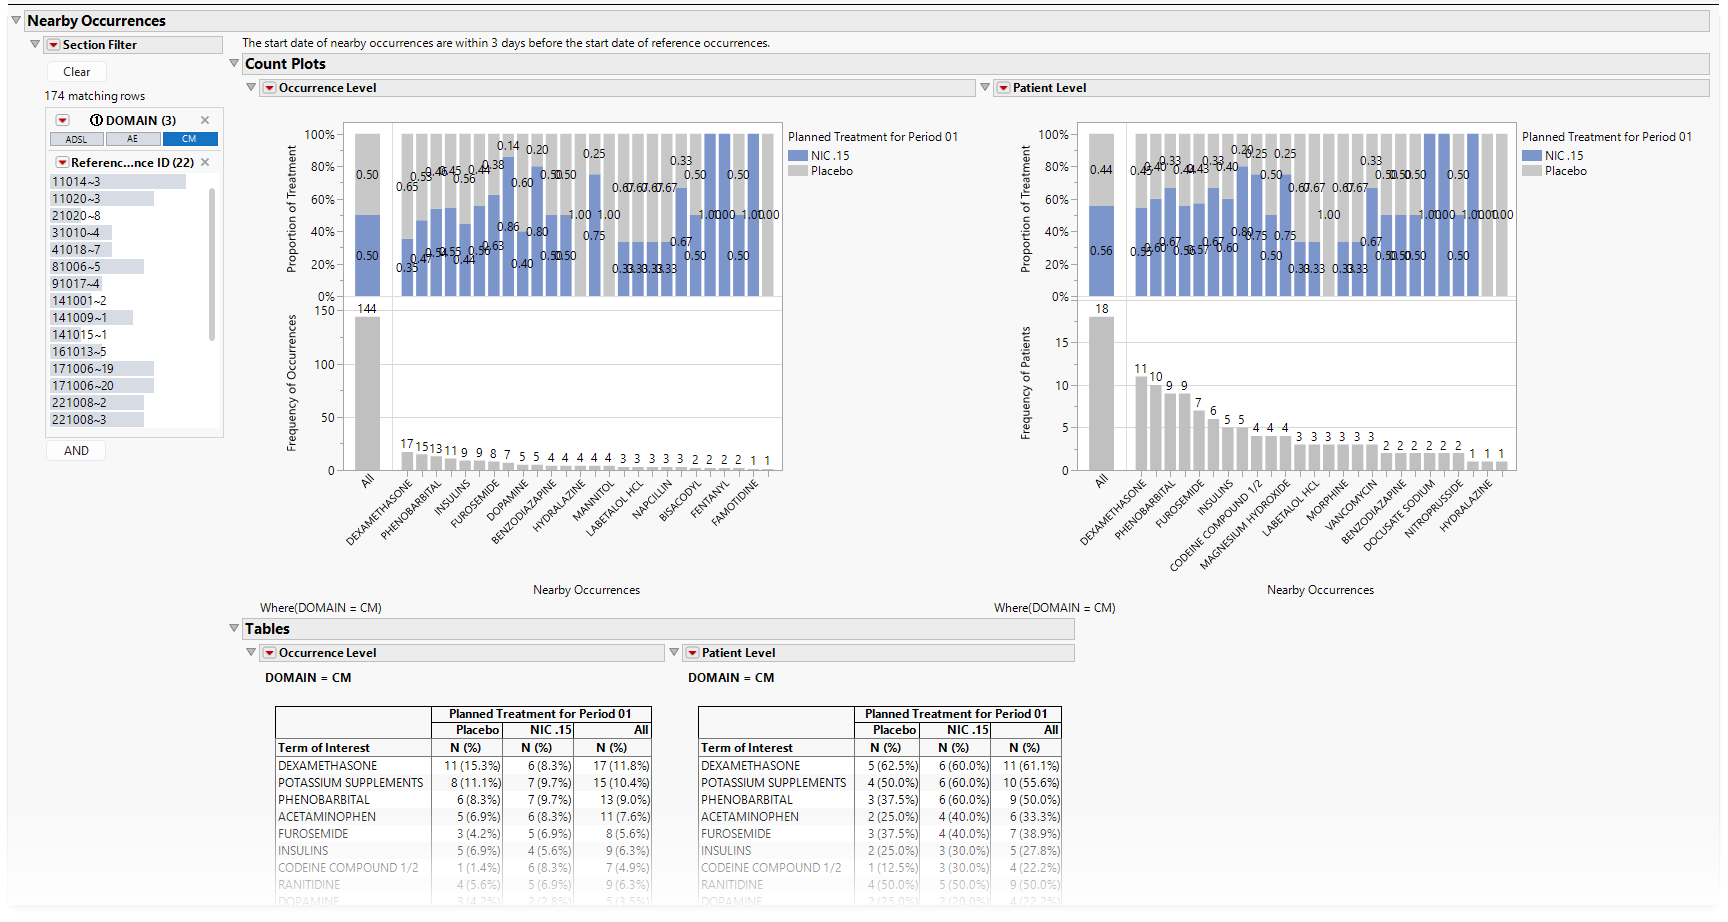
Based on the results, the following is true:
| • | Occurrence Level |
| • | There are 181 CM occurrences that are nearby to the 23 SAEs from the HLGT cardiac arrhythmias. Of these 181 CM occurrences, 39% and 61% of these CM occurrences take place in patients in the NIC .15 and Placebo arms, respectively. |
| • | The most common nearby CM occurrence is dexamethasone with 17 occurrences, 35% and 65% in NIC .15 and Placebo, respectively. |
| • | Phenobarbital (visible when the graphic is enlarged) has 13 occurrences. |
| • | Given the larger amount of grey compared to blue in the stacked bar chart (and the 39% compared to 61% of all CM occurrences), more nearby CM occurrences were started for patients in the Placebo arm. 12.2% of all nearby CM occurrences were potassium supplements. |
| • | Patient Level |
| • | All 17 patients identified based on reference occurrences have nearby CM occurrences for the 23 SAEs from the HLGT cardiac arrhythmias. |
| • | Twelve patients had phenobarbital (and given there are 18 instances at the occurrence level, some patients had it more than once in those 3 days). Eleven patients had potassium supplements (and given there are 18 instances at the occurrence level, some patients had it more than once in those 3 days). |
| • | 70.6% of patients had phenobarbital, 2/3 of which were on NIC .15. |
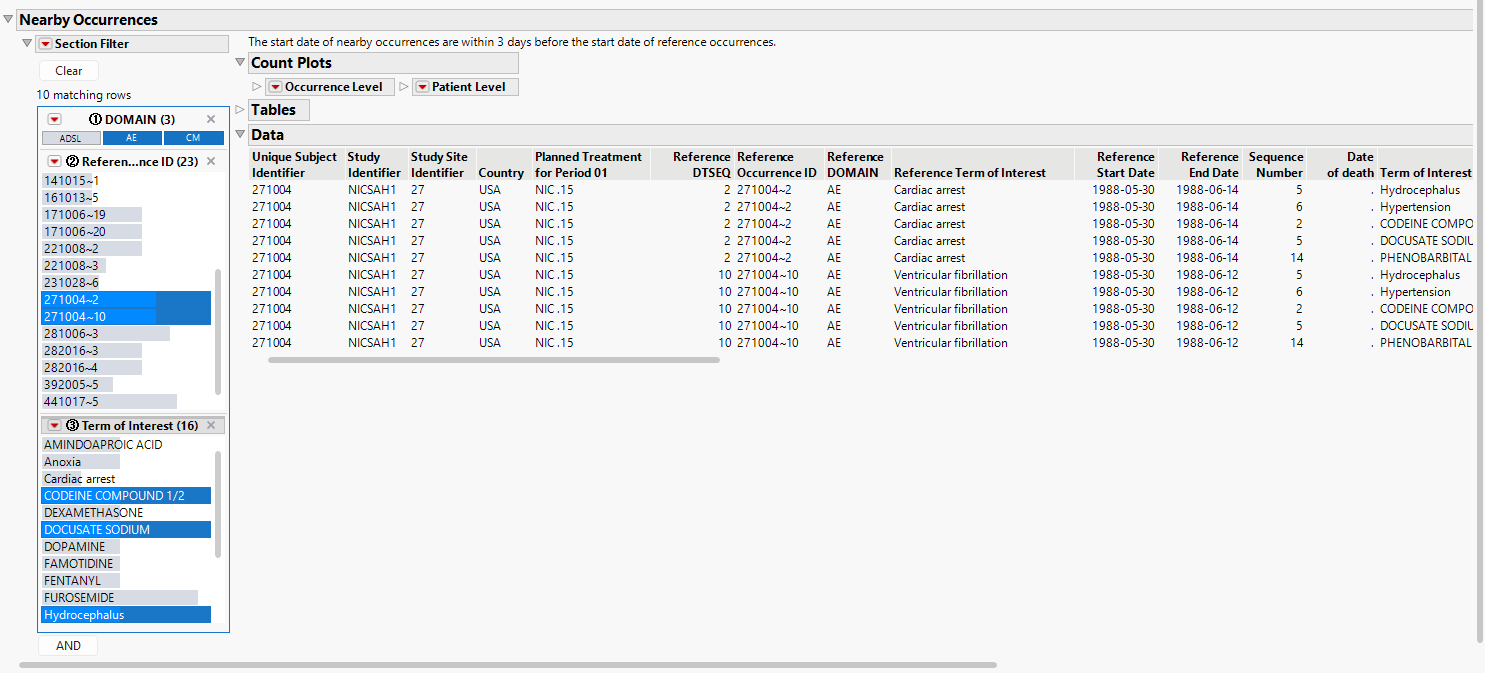
Here, the Data window may be of more interest to the user to see the details for nearby occurrences. Note that the figures and tables shown above display unique nearby occurrences. However, the Data window will show all of the nearby occurrences that are appropriate for each reference occurrence, even if the nearby occurrences are presented multiple times.
For example, the figure below shows (all) nearby occurrences for patient 271004. The same 2 AEs and 3 medications are shown for each reference occurrence (one cardiac arrest and one ventricular fibrillation). This is to help indicate the specific occurrence that corresponds to each reference occurrence. Note that the user can subset to each reference ID in the data filter for ease of review.
The report will still include reference occurrences in the output even when no nearby occurrences are present. The easiest way to observe these instances (if they occur) is to select the missing domain in the data filter.
Nearby Occurrences only needs to be run once to produce the data table for querying. The user can run as many queries as are of interest. The user can alter the query criteria and click Run Query to update the Nearby Occurrences output. This is especially useful if the reference occurrences have not changed but the initial queries for nearby occurrences were non-informative. However, if a new set of reference occurrences is of interest, the user need only clear the local data filter for the reference occurrences to select new items of interest.
Crossover Trials
Nearby Occurrences is available for crossover trials or trials where treatments vary according to study periods. Patient level summaries are based on planned or actual arm. Occurrence level summaries are based on occurrence level treatment values (denoted by JMPC_TRTP or JMPC_TRTA). Tables also include analysis period in the summary where appropriate.
Missing Dates
In practice, missing dates for deaths and AEs are likely not to occur. However, medications for chronic disease may have unknown start dates (indicating the medication was started long in the past) or unknown end dates (implying the drug is still being used to manage disease). While JMP Clinical makes every effort to impute dates according to pre-defined rules, in some instances missing dates may still occur. Nearby Occurrences makes the following assumptions for missing dates:
| • | For specific queries that look for nearby occurrences relative to start and stop dates, records can only be determined to be "near each other" when the dates used in the query are both non-missing. In other words, missing start dates are assumed to have occurred so far in the past that they could not be interpreted to be "nearby". Similarly, missing end dates are assumed to have not occurred to imply the medication or event is still ongoing so that they have not ended. |
| • | For queries of any overlap, a missing start date is assumed to be at the beginning of time, while a missing end date is assumed to be at the end of time. A missing start date and non-missing end date means the occurrence started at the beginning of time and ended at the non-missing end date. A missing end date and non-missing start date means the occurrence started at the non-missing start date and is still ongoing, presumably until the end of time. A missing start date and missing stop date means the occurrence started at the beginning of time and is still ongoing, presumably until the end of time. These assumptions make it possible to identify nearby occurrences with some overlap in time with reference occurrences when one or both dates are missing. |
For instances where the stop dates of medications or AEs were not collected as part of the eCRF design, the stop dates are assumed to be equal to the start dates. In other words, the occurrences start and end on the same day. This assumption is always made for deaths.
Options
Data
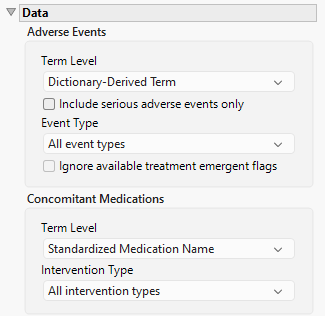
Term Level
Term Levels are determined by the coding dictionary for the Event/Intervention domain of interest, typically these levels follow the MedDRA dictionary. Use this widget to specify how each adverse event is named and the level at which the event is considered. For example, selecting Reported Term for the Adverse Event reports the event specified by the actual event term as reported in the AE domain. Refer to Term Level for more information.
Include serious adverse events only
By default, all events are included in the analysis. However, you can opt to include only those considered serious. Checking the Include serious adverse events only widget restricts the analysis to those adverse events defined as Serious under FDA guidelines.
Event Type
Analysis can consider all events or only those that emerge at specific times before, during, or after the trial period. For example, selecting On treatment events as the Event Type includes only those events that occur on or after the first dose of study drug and at or before the last dose of drug (+ the offset for end of dosing).
Ignore available treatment emergent flags
If you choose to ignore available treatment emergent flags, the analysis includes all adverse events that occur on or after day 1 of the study.
Term Level
Term Levels are determined by the coding dictionary for the Event/Intervention domain of interest, typically these levels follow the MedDRA dictionary. Use this widget to specify how each intervention is named and the level at which the intervention is considered.
Intervention Type
Analysis can consider all interventions or only those that occur at specific times before, during, or after the trial period. For example, selecting On treatment events as the Intervention Type includes only those interventions that occur on or after the first dose of study drug and at or before the last dose of drug (+ the offset for end of dosing).
Display
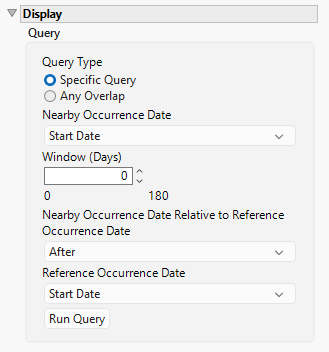
Query Type
Use this option to specify the type of query to run. Options include:
Specific Query
This query will search for nearby occurrences by comparing the Start/Stop date of the reference occurrences to the Start/Stop of the nearby occurrences. If the nearby occurrences occur within the selected number of days after, before, or before or after the selected dates, they will be summarized in the Nearby Occurrences area of the output. Note that a window of 0 days will identify occurrences that occur on the same date.
Any Overlap
This query will search for nearby occurrences by assessing whether there is any overlap in time based on the start and end dates of the reference and nearby occurrences.
Nearby Occurrence Date
Use the drop-down menu to select the nearby occurrence date to use. Options include the start date or the end date of the study.
Window (Days)
Use this option to set the size of the time window with which an occurrence must take place relative to the reference occurrence to be considered "nearby".
Nearby Occurrence Date Relative to Reference Occurrence Date
Use the drop-down menu to select the time the nearby occurrence happens relative to the reference occurrence. Options include before the reference occurrence, after the reference occurrence, or both before and after.
Reference Occurrence Date
Use the drop-down menu to select the reference occurrence date to use. Options include the start date or the end date of the study.
Run Query
Click to run the analysis.
General and Drill Down Buttons
Action buttons provide you with an easy way to drill down into your data. The following action buttons are generated by this report:
| • | Click  to reset all report options to default settings. to reset all report options to default settings. |
| • | Click  to view the associated data tables. Refer to Show Tables for more information. to view the associated data tables. Refer to Show Tables for more information. |
| • | Click  to generate a standardized pdf- or rtf-formatted report containing the plots and charts of selected sections. to generate a standardized pdf- or rtf-formatted report containing the plots and charts of selected sections. |
| • | Click  to generate a JMP Live report. Refer to Create Live Report for more information. to generate a JMP Live report. Refer to Create Live Report for more information. |
| • | Click  to take notes, and store them in a central location. Refer to Add Notes for more information. to take notes, and store them in a central location. Refer to Add Notes for more information. |
| • | Click  to read user-generated notes. Refer to View Notes for more information. to read user-generated notes. Refer to View Notes for more information. |
Default Settings
Refer to Set Study Preferences for default Subject Level settings.