Output Description
ANOVA
Running this process using the DrosophilaAgingExample sample setting generates the tabbed Results window shown below. Refer to the ANOVA process description for more information. Output from the process is organized into tabs. Each tab contains one or more plots, data panels, data filters, and so on. that facilitate your analysis.

The Results window contains the following panes:
Tabs
This pane enables you to access and view the output plots and associated data sets on each tab. Use the drop-down menu to view the tab in the Tab Viewer pane, open the tab in a new window, or remove the tab and its contents from the Tab Viewer pane.

The following tabs are generated by this process:
| • | Results: This tab shows the primary results from the analysis, including volcano plots and various analyses on least squares means |
| • | Variability Estimates: This tab shows the analyses on variance component estimates from the ANOVA model fits. |
| • | Standardized Residual Plots: This tab shows the analyses on residuals from the anova model fits when you have requested them in the dialog. |
| • | Chromosome Position Plots: This tab shows a separate overlay plot for each chromosome of the meta-analysis p-value by chromosome location for the markers This tab is generated whenever a Chromosome Variable is specified. |
| • | Fixed Effects Tests:This tab shows the proportion of your data that can be explained by the specified fixed effects. This tab is generated whenever one or more Additional Fixed Effects are specified. |
| • | Goodness of Fit: This tab shows how well the count data fits with the specified model. It is generated for count data only. |
Drill Downs
Action buttons provide you with an easy way to drill down into your data.
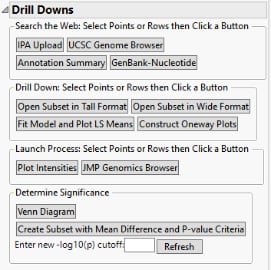
The following action buttons are generated by this process:
| • | IPA Upload: Select points or rows and click to open the IPA Upload process with the selected points specified as input data. |
| • | UCSC Genome Browser: Select points or rows and click to open the UCSC Genome Browser process with the selected points specified as input data. |
| • | Annotation Summary: Select points or rows and click to summarize annotation information for the selected genes or markers |
| • | GenBank Nucleotide: Select points or rows and click to opens a browser window directed to a GenBank Nucleotide search for the selected molecular entities. |
| • | Open Subset in Tall Format: Select points or rows and click to create a tall version of the input data for the selected genes. |
| • | Open Subset in Wide Format: Select points or rows and click to create a wide version of the input data for the selected genes. |
| • | Fit Model and Plot LS Means: Select points or rows and click to select variable(s) that uniquely define wide column names. Selected genes are analyzed in the JMP Fit Model platform to view detailed fitting results and plots. |
Attention: Read the warning found in the link.
| • | Construct One-way Plots: Click to plot the original data in one-way format using treatment variables of your choice. |
| • | Launch Plot Intensities: Select points or rows and click to launch the Plot Intensities process on the selected genes. |
| • | Launch JMP Genomics Browser: Select points or rows and click to launch the JMP Genomics Browser process for the selected points. |
| • | Venn Diagram: Click to launch an open dialog from which you can select up to 5 comparisons and create a Venn diagram to display the overlap of significant genes from those comparisons. |
| • | Create Subset with Mean Difference and P-value Criteria: Optionally select points in a graph. Click to create custom subsets based on mean differences and/or p-value cut offs that you specify in a window that appears after you click this action button. Each l probes with at least one of the results1 satisfying all of the cutoff criteria specified (Mean Difference Filter Cutoff, Direction of the Cutoff, and -log10(p-value) Cutoff fields) is placed in the subset data set. |
Note: This button is not surfaced unless Fixed Effects for Differential Expression are specified.
| • | Enter new -log10(p) cutoff: Enter a new value in the text box to change the horizontal dashed red line in the volcano plots that is used for determining statistical significance. Click to update all plots to reflect the new cutoff. |
Output Data
This process generates the following data set:
| • | Significant Differences Data Set: This output data set contains a complete list of the genes significant by one or more criteria, including Fit Statistics. This data set is indicated by the _sig suffix. Click  to view the data set. to view the data set. |
The ANOVA and Mixed Model processes create a large output table with numerous statistics relevant to analyzing and testing differential expression.Variables in this data set are named using the conventions in the table below:
|
SAS Variable Name |
Description |
|
Variance_ |
Estimate of variance component for associated random effect |
|
Variance_Array |
Variance of the array for each gene. |
|
Variance_Residual |
Variance of the residual for each gene. |
|
Sum_Variance |
Summary of the Varience_Array and Varience_Residual for each gene |
|
PropVar_ |
Proportion of total variance |
|
PropVar_Array |
Proportion of Array Variance. This is calculated by dividing the Variance_Array by the SumVariance. |
|
N2RLL |
-2 REML log likelihood |
|
RSquare |
Coefficient of Determination |
|
AIC |
Akaike Information Criterion |
|
AICC |
Corrected Akaike Information Criterion |
|
BIC |
Bayesian information criterion |
|
F_T3_XX |
F statistics for the type III test. F_T3 serves as a common prefix. The _XX suffix, appended to the prefix, indicates the specific variable(s) (Sex or Age, for example) used in the analysis. When more than one variable is considered (the interaction of Sex by Age, for example) each variable is appended to the prefix as follows: F_T3_Sex_Age. |
|
NDF_T3_XX |
Numerator degrees of freedom for the type III test. NDF_T3 serves as a common prefix. The _XX suffix, appended to the prefix, indicates the specific variable(s) (Sex or Age, for example) used in the analysis. When more than one variable is considered (the interaction of Sex by Age, for example) each variable is appended to the prefix as follows: NDF_T3_Sex_Age. |
|
DDF_T3_XX |
Denominator degrees of freedom for the type III test. DDF_T3 serves as a common prefix. The _XX suffix, appended to the prefix, indicates the specific variable(s) (Sex or Age, for example) used in the analysis. When more than one variable is considered (the interaction of Sex by Age, for example) each variable is appended to the prefix as follows: DDF_T3_Sex_Age. |
|
PrF_T3_XX |
Probability of the type III test = the p-value. PrF_T3 serves as a common prefix. The _XX suffix, appended to the prefix, indicates the specific variable(s) (Sex or Age, for example) used in the analysis. When more than one variable is considered (the interaction of Sex by Age, for example) each variable is appended to the prefix as follows: PrF_T3_Sex_Age. |
|
LSMean_ |
Least squares mean |
|
Std LSMean_ |
Standardized least squares mean |
|
Sig Index |
Binary significance flag based on p-value and cutoff |
For detailed information about the files and data sets used or created by JMP Genomics software, see Files and Data Sets.
Launch Follow-up Processes
| • | Gene Set Enrichment: Click to launch the Gene Set Enrichment process with the Significant Differences Data Set preloaded as input. |
Tab Viewer
This pane provides you with a space to view individual tabs within the Results window.
General
| • | Click to surface the data sets corresponding to the active tab. |
| • | Click to reopen the completed process dialog used to generate this output. |
| • | Click to generate a pdf- or rtf-formatted report containing the plots and charts of selected tabs. |
| • | Click to close all graphics windows and underlying data sets associated with the output. |