The experimental data in the Tiretread.jmp sample data table results from an experiment to study the effects of SILICA, SILANE, and SULFUR on four measures of tire tread performance. In this example, you will consider only one of the responses, ABRASION.
|
1.
|
|
2.
|
Select Analyze > Fit Model.
|
|
3.
|
|
4.
|
|
5.
|
Check Keep dialog open.
|
|
6.
|
Click Run.
|
|
7.
|
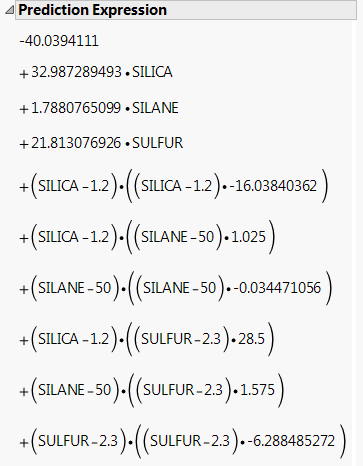
The coefficients do not help you compare effect sizes. The sizes of the coefficients do not reflect the impact of the effects on ABRASION over the range of their settings. Also, the coefficients are not easily interpreted. For example, the coefficients do not facilitate your understanding of the predicted response when SILICA is at the midpoint of its range.
|
8.
|
In the Tiretread.jmp data table, select SILICA, SILANE, and SULFUR in the Columns panel. Right-click the highlighted column titles and select Standardize Attributes.
|
|
9.
|
Select Column Properties > Coding in the Standardize Properties panel.
|
|
10.
|
Click OK.
|
An asterisk appears in the Columns panel next to SILICA, SILANE, and SULFUR indicating that these have been assigned a column property.
|
11.
|
|
12.
|
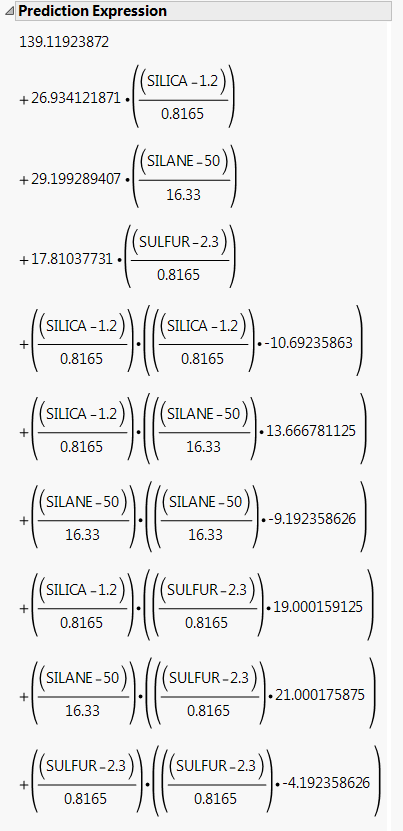
The coefficients for the coded factors enable you to compare effect sizes. SILANE has the largest effect on ABRASION over the range of design settings. The effects of SILICA and the SILANE*SULFUR interaction are large as well.
The coefficients for the coded factors are also more easily interpreted. For example, when all factors are at the center of their ranges, the predicted value of ABRASION is the intercept, 139.12.
|
13.
|
Close the Tiretread.jmp sample data table without saving the changes.
|