 with
with 
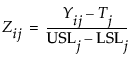
Capability Box Plot shows the Capability Box Plot for the Semiconductor Capability.jmp sample data table. The left and right dotted green lines, drawn at ±0.5, represent the standardized LSLj and USLj respectively. This plot is useful for comparing variables with respect to their specification limits. For example, the majority of points for IVP1 are above its USL, while the majority of its points for IVP2 are less than its target. PNP2 looks to be on target with all data points in the spec limits.
When a spec limit is missing for a column, the box plot is colored. If only the upper spec limit (USL) is specified, the box plot is colored blue. If only the lower spec limit (LSL) is specified, the box plot is colored red. See Missing Spec Limits. A note at the bottom of the plot describes the calculations used for the plot.