The Goal Plot shows, for each variable, the spec-normalized mean shift on the x-axis, and the spec-normalized standard deviation on the y-axis. It is useful for getting a quick, summary view of how the variables are conforming to specification limits. Hold your cursor over each point to view the variable name. The Goal Plot red triangle menu has the following commands:
Goal Plot shows the Goal Plot for the entire data set for the Semiconductor Capability.jmp sample data table after selecting Shade CPK Levels from the Goal Plot red triangle menu.
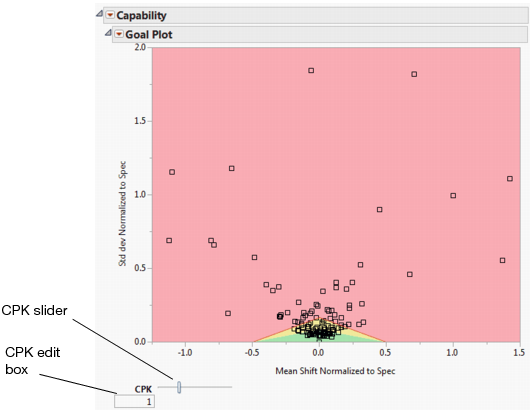
JMP has a preference for plotting PPK instead of CPK. When this is on, the slider is labeled with PPK. You can change the preference at File > Preferences > Platforms > Capability.