After changes are made to improve a measurement process, a measurement systems analysis study is conducted to study repeatability and reproducibility with Part, Operator, and Instrument as factors. Each of three operators measures each of eight parts with four instruments. Of particular interest is the consistency of the instruments. The measured quantity is called new Y.
|
1.
|
|
2.
|
Select Graph > Graph Builder.
|
|
3.
|
|
4.
|
Select Part and drag it to the X zone.
|
|
5.
|
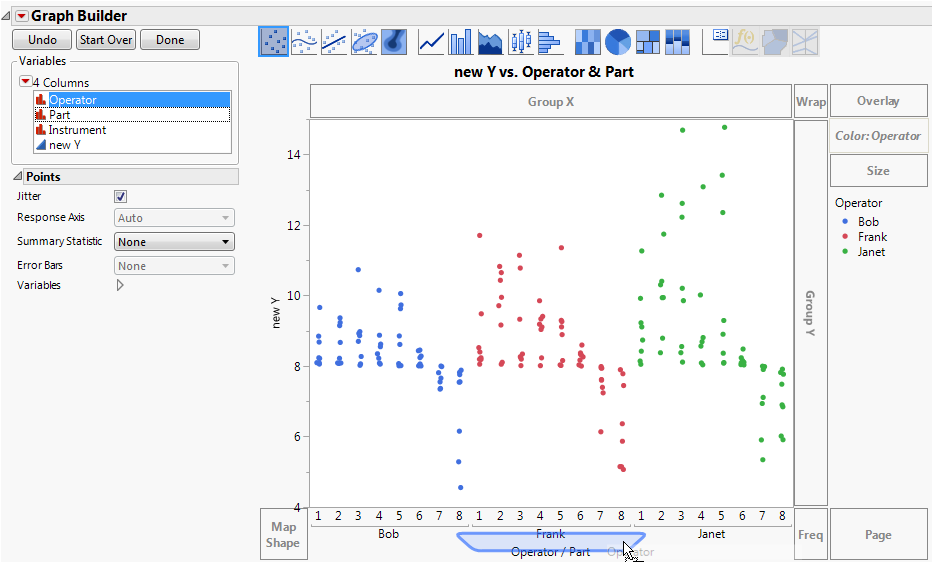
The new Y values are colored by Operator, using the legend at the right of the graph. It appears that Janet might be measuring higher values than the other two operators on most parts. But the Operator effect is not easy to visualize, so you create a separate Operator axis.
|
6.
|
The label Operator/Part appears, indicating that Part is associated with the topmost axis, and Operator is associated with the lower axis.
Drag Operator to Add a Second Axis
|
7.
|
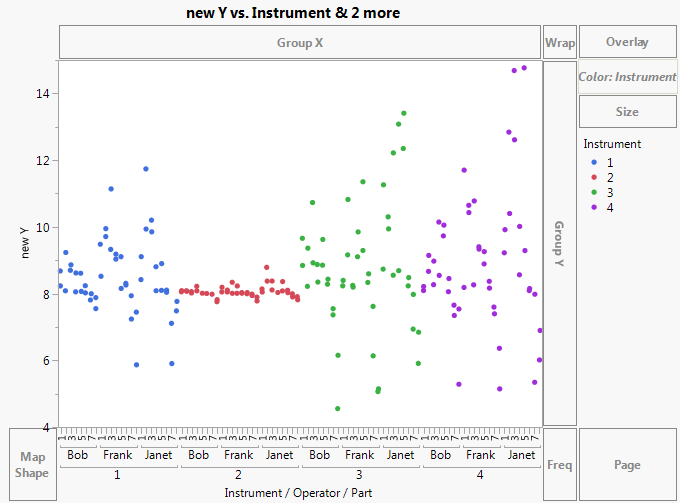
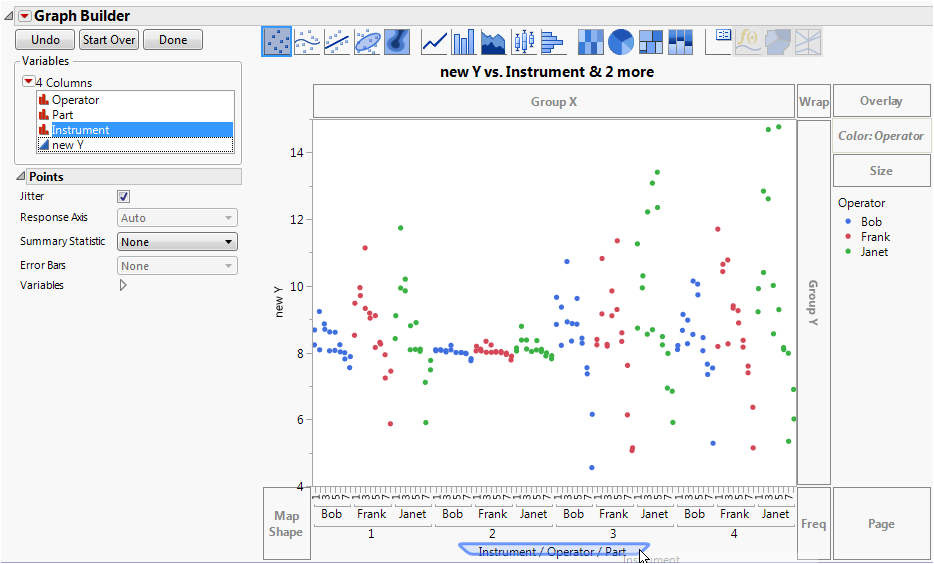
The label Instrument/Operator/Part appears, indicating that a third axis for Instrument has been added beneath the Operator axis.
Drag Instrument to Add a Third Axis
|
8.
|