|
•
|
|
1.
|
Right-click on the axis label and select Order By.
|
|
3.
|
Note: If you try to order the values of a numeric variable using another numeric variable, JMP merges the variables. See Merge Variables on a Common Axis.
|
1.
|
|
2.
|
Select Graph > Graph Builder.
|
|
3.
|
This variable represents the type of the vehicle. Eight levels are listed alphabetically on the X axis: compact (comp), heavy (hev), lightweight (lt), medium (med), mini, multi-purpose (mpv), pick-up truck (pu), and van. Since the levels are listed alphabetically, they are not ordered in a meaningful way. For example, heavy comes before mini and lightweight. You want to order the levels by Wt (weight).
|
4.
|
Select Wt and drag it to the middle of the X axis. Drop it just above the X axis. Before you drop the variable, a blue quadrilateral appears.
|
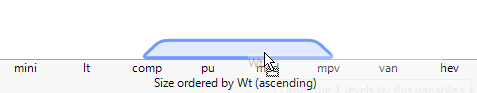
The levels of Size are now arranged in increasing order according to the average Wt of all vehicles in the levels. Notice that mini and lt (lightweight) are now ordered before hev (heavy). The axis label is updated, signifying that an ordering variable is in use.
|
5.
|
|
6.
|
Select Mean from the Summary Statistic list.
|
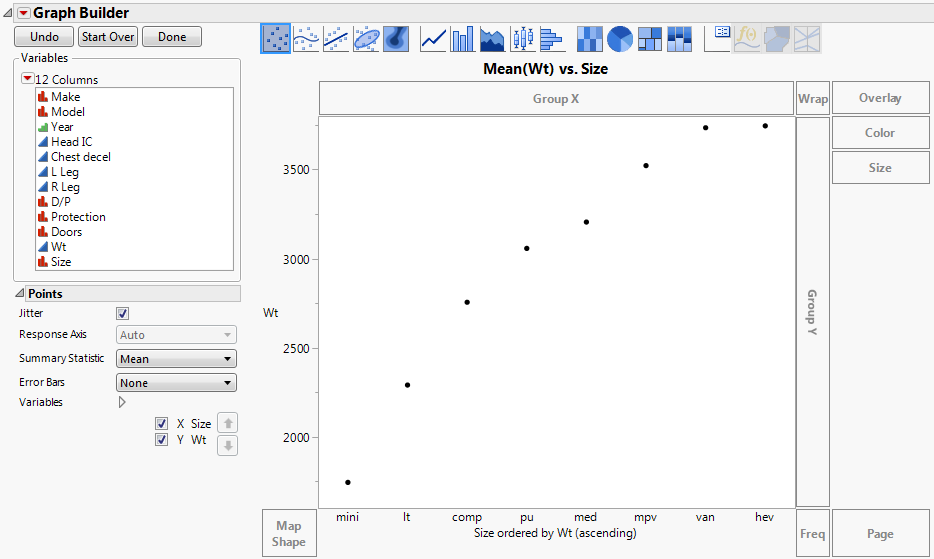
You can see that the average Wt increases from left to right.
|
7.
|
Now the levels of Size are arranged in decreasing order of mean Wt. You want to see if the right femur load (R Leg) decreases with vehicle weight.
|
8.
|
|
9.
|
Select R Leg and drag it to the Y zone.
|
|
10.
|
Select None from the Summary Statistic list.
|
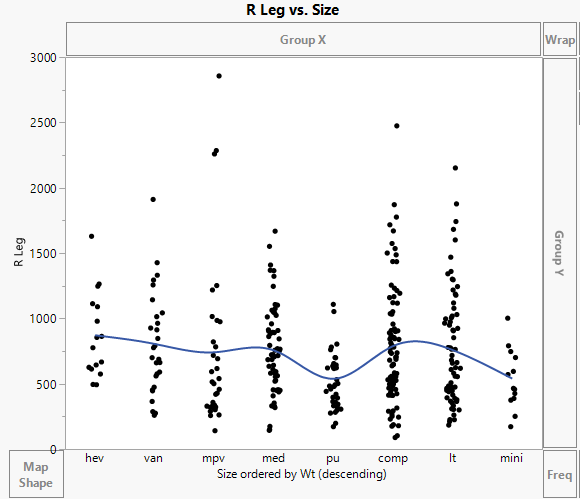
R Leg seems unrelated to the weight classes.
The default ordering statistic is the mean. To use another statistic, right-click in the X zone, select Order By and change it to the statistic you want. To remove the ordering, select None.
Note: For details about the Axis and Edit menu options, see Customize Axes and Axis Labels in the Axis Settings Window and Access Report Display Options in the Using JMP book.