New Window("title", <arguments>, Graph Box( named arguments,..., script));
The following arguments are named arguments for Graph Box():
Frame Size( horizontal, vertical ), // size in pixels
X Scale( xmin, xmax ), Y Scale( ymin, ymax ), // range of x and y axes
X Name( "x" ), Y Name( "y" ), // names for x and y axes
Suppress Axes // omit the axes
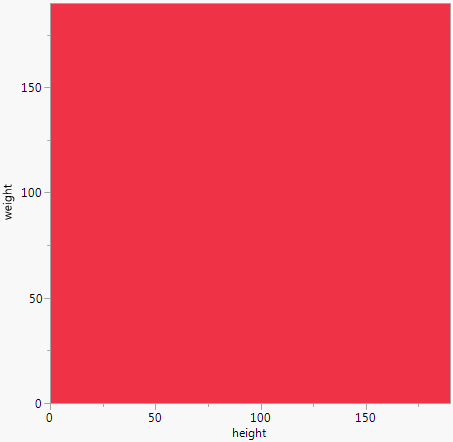
For example, Graph Box() accepts named arguments as shown in the following example, which creates a graph with a red background.
win = New Window( "Named arguments",
Graph Box(
Frame Size( 300, 300 ), // construct the graph box
X Scale( 0, 190 ), // set the x-axis increments
Y Scale( 0, 190), // set the y-axis increments
X Name( "height" ),
Y Name( "weight" ),
<<Background Color( "Red" ) // sets the background color
)
);
Alternatively, you can use the send << operator to send commands to the Graph Box instead of using the named arguments. This example also creates a graph with a red background.
win = New Window( "Messages",
Graph Box(
<<Frame Size( 300, 300 ),
<<XAxis( 0, 190 ),
<<YAxis( 0, 190 ),
<<Background Color( "Red" )
)
);