Frame Box <<Add Graphics Script(<("Back"|"Front") | <n>>, <"description">, script)
The optional order argument specifies in what order to draw the graphics element. Order can be the keyword Back or Front or an integer that specifies the drawing order for a number of graphics elements. For example, if you add an oval to a scatterplot, the oval is drawn on top of the markers. The keyword Back or 2 cause the oval to be drawn in the background. Front or 1 means the object is drawn first.
The optional Description argument is a string that appears in the Customize Graph window next to the graphics script.
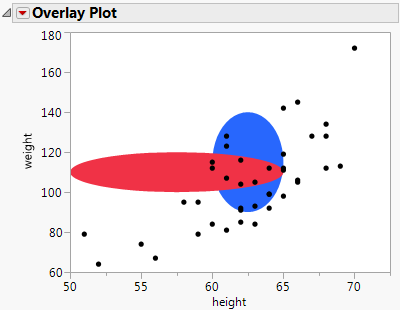
To specify the drawing order for a number of graphics elements, use an integer for the order argument to determine where each is drawn in relation to the others. The following script first adds a blue oval and then a red oval in front of the blue oval. Both ovals are behind the points.
dt = Open( "$SAMPLE_DATA/Big Class.jmp" );
op = dt << Bivariate(
X( :height ),
Y( :weight ),
);
Report( op )[Frame Box( 1 )] << Add Graphics Script(
1, // draw the blue oval in the foreground
Description( "Blue Oval" ),
Fill Color( "Blue" );
Oval( 60, 140, 65, 90, 1 );
);
Report( op )[Frame Box( 1 )] << Add Graphics Script(
2, // draw the red oval in the background
Description( "Red Oval" ),
Fill Color( "Red" );
Oval( 50, 120, 65, 100, 1 );
);
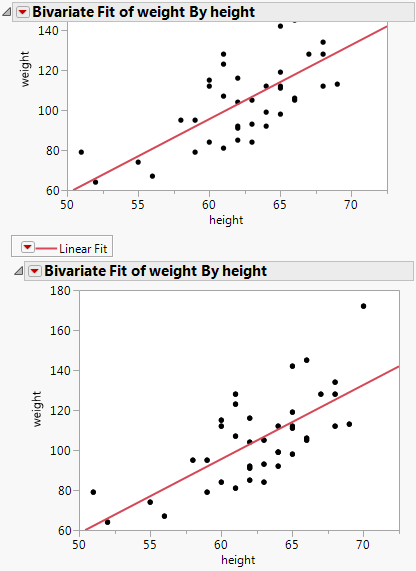
obj << Copy Frame Contents // contents such as a graph or line of fit
obj << Paste Frame Contents
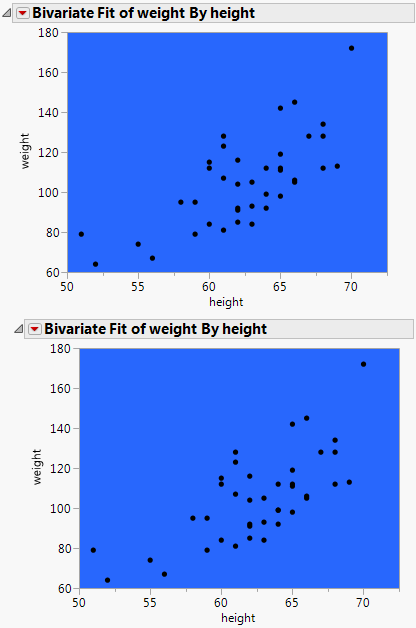
obj << Copy Frame Settings // settings such as background color
obj << Paste Frame Settings
dt = Open( "$SAMPLE_DATA/Big Class.jmp" );
biv = dt << Bivariate( y( :weight ), x( :height ) );
rbiv1 = biv << Report; // create a report object
rbiv2 = rbiv1 << Clone Box; // create a copy of the Bivariate graph
rbiv1 << Append( rbiv2 );
// place the cloned box below the Bivariate graph
// to create a second Bivariate graph
framebox1 = rbiv1[Frame Box( 1 )]; // assign references to the reports’ frame boxes
framebox2 = rbiv2[Frame Box( 1 )];
biv << Fit Line; // fit a line to the first Bivariate graph
framebox1 << Copy Frame Contents;
// copy the frame contents from framebox1
framebox2 << Paste Frame Contents;
// paste the frame contents to framebox2
dt = Open( "$SAMPLE_DATA/Big Class.jmp" );
biv1 = dt << Bivariate( y( :weight ), x( :height ) );
// create the first Bivariate graph
rbiv1 = biv1 << Report; // create a report object
rbiv2 = rbiv1 << Clone Box; // create a copy of the Bivariate graph
rbiv1 << Append( rbiv2 );
// place the cloned box below the Bivariate graph
// to create a second Bivariate graph
framebox1 = rbiv1[Frame Box( 1 )]; // assign a reference to the reports’ frame boxes
framebox2 = rbiv2[Frame Box( 1 )];
framebox1 << Background Color( "Blue" );
// assign the background color to framebox1
framebox1 << Copy Frame Settings;
// copy the frame settings from framebox1
framebox2 << Paste Frame Settings;
// paste the frame settings to framebox2
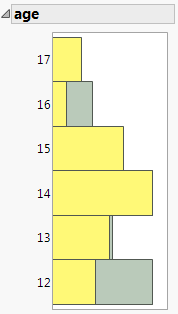
dt = Open( "$SAMPLE_DATA/Big Class.jmp" );
dist = dt << Distribution(
SendToByGroup( {:sex == "F"} ),
Nominal Distribution( Column( :age ) ),
Histograms Only,
By( :sex ),
SendToByGroup(
{:sex == "M"},
SendToReport(
Dispatch(
{"Distributions sex=M", "age"},
"Distrib Nom Hist",
FrameBox,
{DispatchSeg(
Hist Seg( 1 ),
Fill Color( "Light Yellow" ),
// set the histogram color for males
)}
)
)
)
);
For( i = 2, i <= N Items( dist ), i++,
Report( dist[i] )[FrameBox( 1 )] << Copy Frame Contents;
// copy the the second histogram into the first histogram
Report( dist[1] )[FrameBox( 1 )] << Paste Frame Contents;
);
New Window( "Distribution", Outline Box( "age", Report( dist[1] )[Picture Box( 1 )] ) );
To interactively copy and paste the frame settings, right-click the graph and select Edit > Copy Frame Settings. Right-click the frame to which you want to paste the settings and select Edit > Paste Frame Settings.
To interactively copy and paste the frame contents, right-click the graph and select Edit > Copy Frame Contents. Right-click the frame to which you want to paste the contents and select Edit > Paste Frame Contents.