Example of Creating a Dashboard with Two Reports shows how to create a dashboard from two reports. This section shows how to arrange those reports and preview the final dashboard.
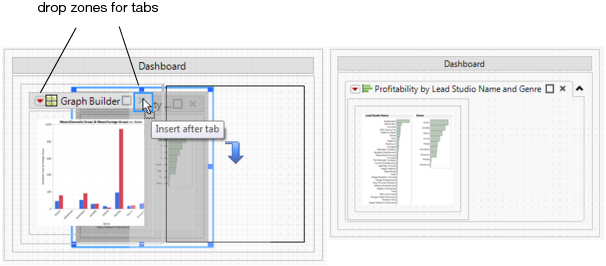
Working with Tabbed Reports in Dashboard Edit Mode shows how to create tabbed reports. To put the Distribution report inside a tab, drag the report over the other report until the upper right corner of the bar chart report is highlighted. The Distribution report appears in a tab on top of the other report.
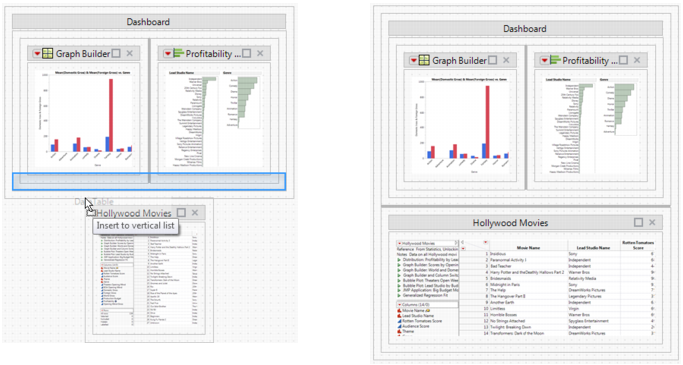
Displaying a Data Table Inside a Report shows an example of placing a data table inside the bottom border of the report.
To display the data table below the report instead of inside it, drag the Data Table box onto the dashboard below the report. The box snaps inside the bottom border of the report.
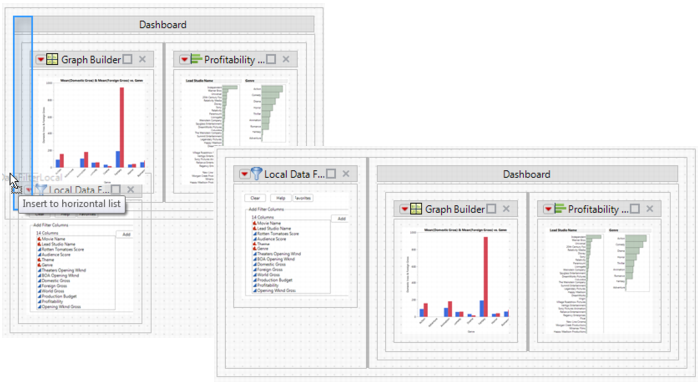
Adding a Data Filter to the Left of a Report shows a data filter that appears to the left of a report.
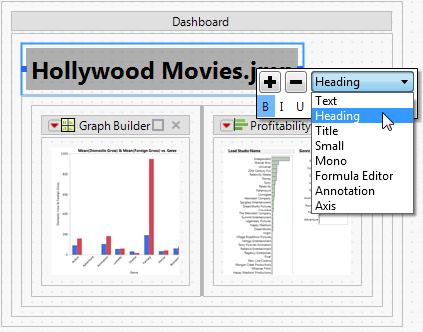
When you edit a dashboard, you can format text in a text box. Drag the text box to the dashboard and click the middle of the text box. Formatting options appear (Formatting Options for a Text Box).
When you edit the dashboard, you can see a preview of the final dashboard by selecting Preview Mode from the Dashboard Builder red triangle menu. Previewing the dashboard is particularly helpful when testing interactive elements such as data filters and tabbed reports.