A report that contains graphs and statistics can grow fairly large. To view only the graphs while running the report, select the top red triangle in a report and then select Report View > Summary. The report shown in Viewing a Summary of the Report originally showed parameter estimates. In the Summary view, only the graphs are shown.

You rearrange reports in a running dashboard by dragging the reports into highlighted drop zones. The drop zones indicate where you can place the report. Creating Tabbed Reports in a Running Dashboard shows an example of moving a report into a tab. The Distribution report is dropped inside the highlighted drop zone to place it on the first tab.

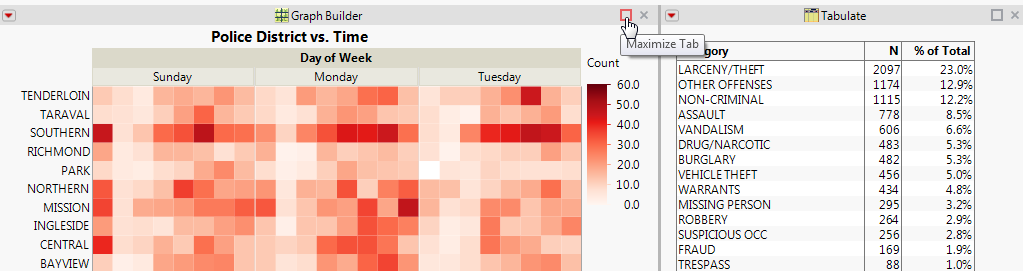
To see only a specific report while running a dashboard, select the report’s Maximize Tab box (Maximizing a Tab). Note that the box is named Maximize Tab even if the reports are not in tabs.
To restore the report to its original size, select the Restore Tab box (Restoring a Maximized Report).
The thick gray line that appears between reports in a dashboard is called a splitter. Drag the splitter to resize the panes. When the pane is too wide to display the enclosed report, the pane closes. Drag the splitter from the outer edge of the dashboard to see all reports again. Resizing Panes in a Running Dashboard shows the collapsed and expanded reports.

You can share reports with users working outside JMP by saving a dashboard as interactive HTML. First, select Run Dashboard from the Dashboard Builder red triangle menu to run the dashboard. In the running dashboard, select File > Save As and then select Interactive HTML with Data from the list. The reports are saved in a web page that also contains the data. Email the web page to users or publish the page on a website. Users then explore the data as they would in JMP. See Save the Report as Interactive HTML for details.