In the Vinyl Data.jmp sample data table, a Response Limits column property is already assigned to the response thickness. The property has a goal of maximizing thickness. Suppose that instead of maximizing thickness, you want the sheets of vinyl to have a thickness between 6 and 10, with a target thickness of 8.5.
|
1.
|
|
2.
|
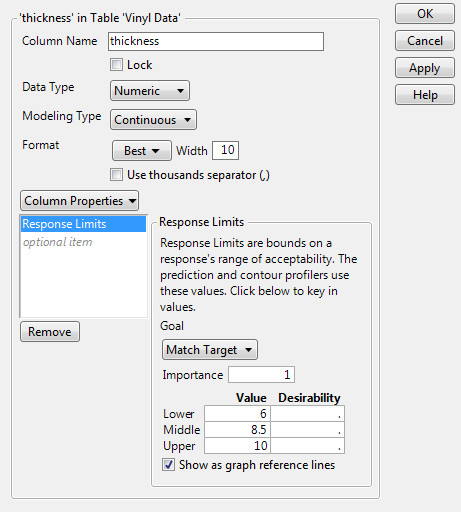
The Response Limits property appears in the Column Properties list as the only property assigned to thickness. The Response Limits panel appears to the right of the list.
|
3.
|
|
4.
|
Type 1 for the Importance value.
|
This is an example of asymmetric response limits. Values of thickness as small as 6 or as large as 10 are acceptable. However, the target for thickness is 8.5.
|
6.
|
Select Show as graph reference lines.
|
|
7.
|
Click OK.
|
|
8.
|
Note that m1, m2, and m3 are mixture factors. Also, the design involves a random Whole Plots factor. Because of this, the default Method is REML (Recommended).
|
9.
|
Click Run.
|
|
10.
|
From the red triangle next to Response thickness, select Row Diagnostics > Plot Actual by Predicted.
|
|
11.
|
From the red triangle next to Response thickness, select Factor Profiling > Profiler.
|
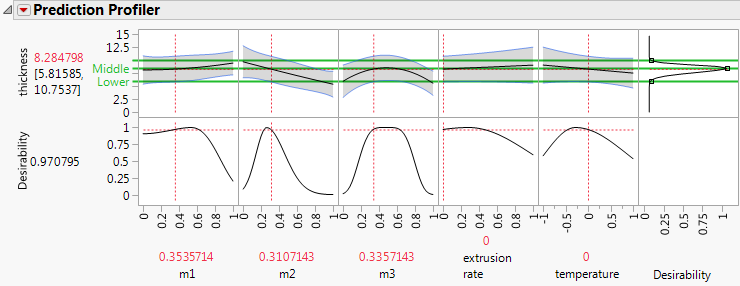
The plot at the right above Desirability shows the desirability function that JMP has constructed for thickness. The desirability is 1 at the Middle limit of 8.5. The desirability is essentially 0 for thickness values below 6 and above 10.
|
12.
|
Hold down the Ctrl key and click the thickness plot for Desirability.
|
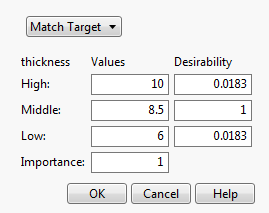
This window shows your settings for the High, Middle, and Low Values. It also shows the Desirability values that JMP assigns, based on your goal of Match Target. The Desirability function shown in Prediction Profiler Showing Asymmetric Desirability Function is a continuous curve that matches the Desirability settings in Response Goal Window for Thickness at the High, Middle, and Low Values. At other values, the Desirability function assigns desirabilities that are consistent with the selected goal.
|
13.
|
Click Cancel.
|
|
14.
|
Select Optimization and Desirability > Maximize Desirability from the Prediction Profiler red triangle menu.
|
The settings for the factors are updated to show values that maximize the desirability function for thickness. Keep in mind that many other settings also maximize the desirability function. The predicted response at these optimal settings is 8.5. Recall that you set 8.5 as the target setting, with limits of 6 and 10.
|
15.
|
Close the Vinyl Data.jmp sample data table without saving the changes.
|