This example uses the Consumer Preferences.jmp sample data table, which contains survey data on people’s attitudes and opinions, as well as questions concerning oral hygiene. You explore the distribution of responses to the statement “I am working on my career” between each age group.
|
1.
|
|
2.
|
|
3.
|
|
4.
|
|
5.
|
Click OK.
|
|
6.
|
Click the Categorical red triangle and select Compare Each Sample.
|
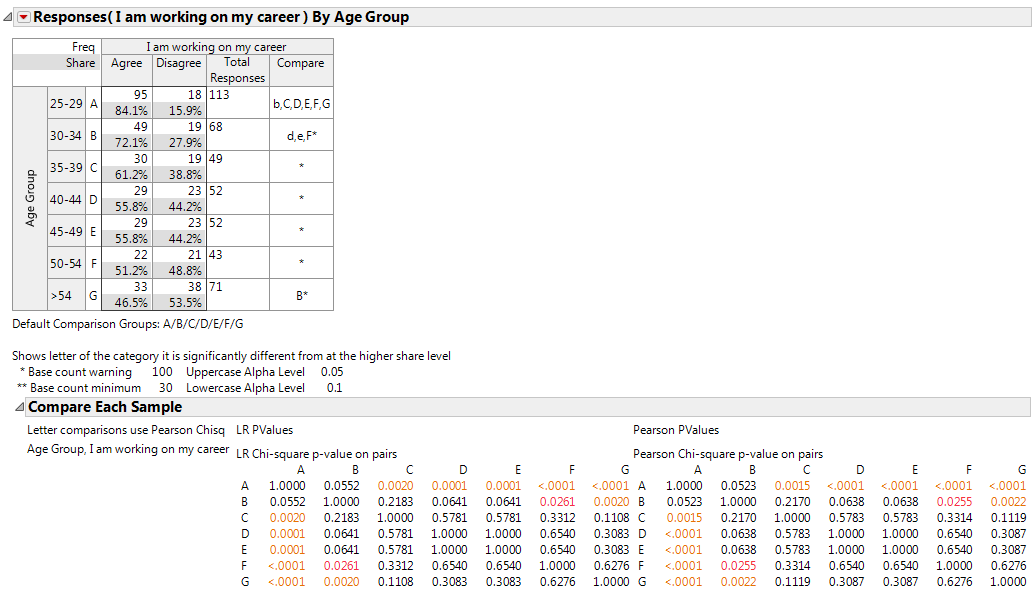
The Compare Each Sample outline provides p-values from the pairwise Pearson and Chi-square likelihood ratio chi-square tests. The p-values are reported in symmetric matrices labeled by the comparison letters.