This example uses the Consumer Preferences.jmp sample data table, which contains survey data on people’s attitudes and opinions, as well as questions concerning oral hygiene. You explore the distribution of responses to the statement “I am working on my career” across age groups.
|
1.
|
|
2.
|
|
3.
|
|
4.
|
|
5.
|
Click OK.
|
|
6.
|
Click the Categorical red triangle and select Crosstab Transposed.
|
|
7.
|
Click the Categorical red triangle and select Cell Chisq.
|
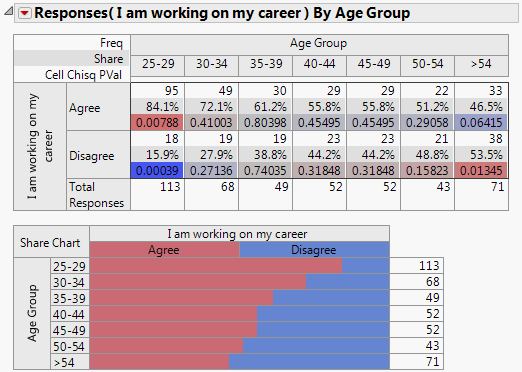
Small p-values indicate that there is a significant difference between the observed cell count and the expected cell count. The p-values are colored by significance level from dark red for cells with significantly higher counts than expected to dark blue for cells with significantly lower counts than expected. The expected cell count is based on the observed row and column totals.
For example, the expected number of responses in the 25 through 29-year-old group who agree is (287*113)/448 = 72.4; the observed value was 95. This observed value, with a p-value of 0.00788, is significantly larger than the expected value. The number of responses in the 25 through 29 group who agree with “I am working on my career” is higher than expected were the response to this question was independent of age.