|
1.
|
|
2.
|
Select Analyze > Fit Y by X.
|
|
3.
|
|
4.
|
|
5.
|
Click OK.
|
To create the example on the left in Example of Regression Analysis for Whole Sample and Grouped Sample:
|
6.
|
Select Fit Line from the red triangle menu.
|
To create the example on the right in Example of Regression Analysis for Whole Sample and Grouped Sample:
|
7.
|
From the Linear Fit menu, select Remove Fit.
|
|
8.
|
From the red triangle menu, select Group By.
|
|
9.
|
|
10.
|
Click OK.
|
|
11.
|
Select Fit Line from the red triangle menu.
|
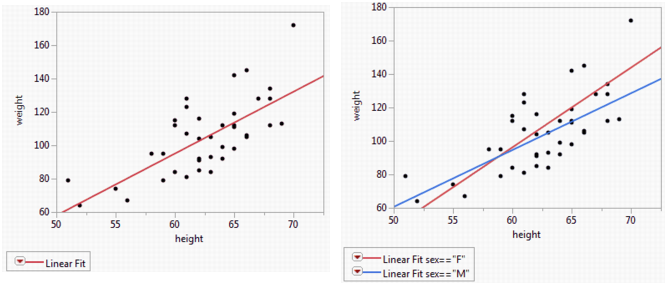
The scatterplot to the left in Example of Regression Analysis for Whole Sample and Grouped Sample has a single regression line that relates weight to height. The scatterplot to the right shows separate regression lines for males and females.