In this example, you use the Cytometry.jmp sample data table to cluster observations using K Means Cluster. Cytometry is used to detect markers of the surface of cells and the readings from these markers help diagnose certain diseases. In this example, the observations are grouped based on readings of four markers in a cytometry analysis.
|
1.
|
|
2.
|
Select Analyze > Clustering > K Means Cluster.
|
|
3.
|
|
4.
|
Click OK.
|
|
5.
|
Enter 3 next to Number of Clusters.
|
|
6.
|
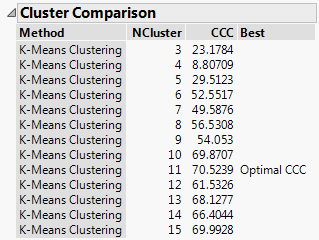
Enter 15 next to Range of Clusters (Optional).
|
|
7.
|
Click Go.
|
|
9.
|
Click the K Means NCluster=11 red triangle and select Parallel Coord Plots.
|
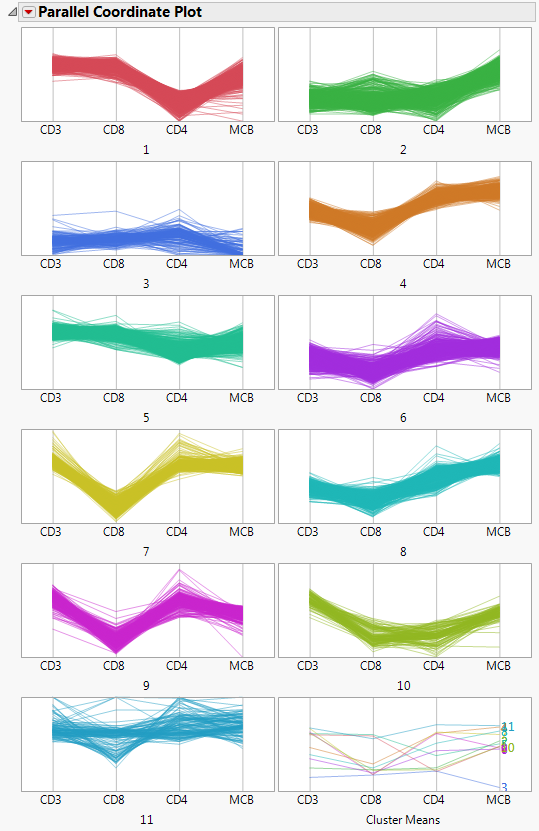
The Parallel Coordinate Plots display the structure of the observations in each cluster. Use these plots to see how the clusters differ. Clusters 4, 6, 7, 8, and 9 tend to have comparatively low CD8 values and high CD4 values. Cluster 1, on the other hand, has higher CD8 values and lower CD4 values.