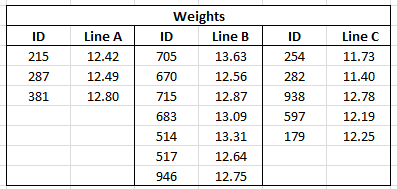
This example uses the file Fill Weights.xlsx, which contains the weights of cereal boxes randomly sampled from three different production lines. Data Format shows the format of the data.
|
2.
|
|
•
|
Use the File > Open option to import data from a Microsoft Excel file using the Excel Import Wizard. See Import the Data Using the Excel Import Wizard. This method is convenient for any Excel file.
|
|
•
|
Copy and paste data from Microsoft Excel into a new JMP data table. See Copy and Paste the Data from Excel. You can use this method with small data files.
|
For more information on how to import data from Microsoft Excel, see Import Microsoft Excel Files in the Using JMP book.
|
1.
|
Select Help > Sample Data Library and open Fill Weights.xlsx located in the Samples/Import Data folder.
|
|
2.
|
Type 3 next to Column headers start on on row.
|
|
3.
|
Type 2 for Number of rows with column headers.
|
|
4.
|
Click Import.
|
|
1.
|
Open Fill Weights.xlsx in Microsoft Excel.
|
|
3.
|
Right-click and select Copy.
|
|
4.
|
In JMP, select File > New > Data Table.
|
|
5.
|
Select Edit > Paste with Column Names.
|
The Edit > Paste with Column Names option is used when you have column names included in the selection on the clipboard.
Use the Stack option to place one observation in each row of a new data table. For more information on the Stack option, see Stack Columns in the Using JMP book.
|
1.
|
In the JMP data table, select Tables > Stack.
|
|
2.
|
Select all six columns and click Stack Columns.
|
|
3.
|
Select Multiple Series Stack.
|
|
4.
|
Deselect Stack By Row.
|
|
5.
|
Select Eliminate Missing Rows.
|
|
6.
|
|
7.
|
Click OK.
|
|
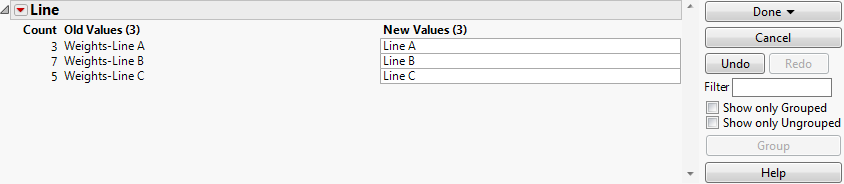
8.
|
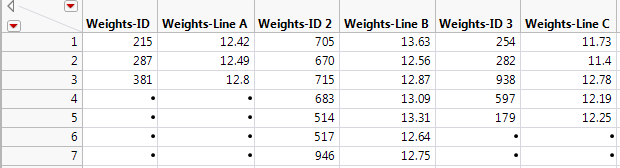
The entries in the Label column were the column headings for the box IDs in the imported data table. These entries are not needed.
|
–
|
Data to ID
|
|
–
|
Label 2 to Line
|
|
–
|
Data 2 to Weight
|
|
10.
|
Although ID is given as a number, it is an identifier and should be treated as nominal when modeling. This is not an issue in this example, but it is good practice to assign the appropriate modeling type to a column.
|
11.
|
(Only applies if you imported the data from Excel using File > Open.) Do the following:
|
|
1.
|
|
2.
|
|
3.
|
Click Done > In place.
|
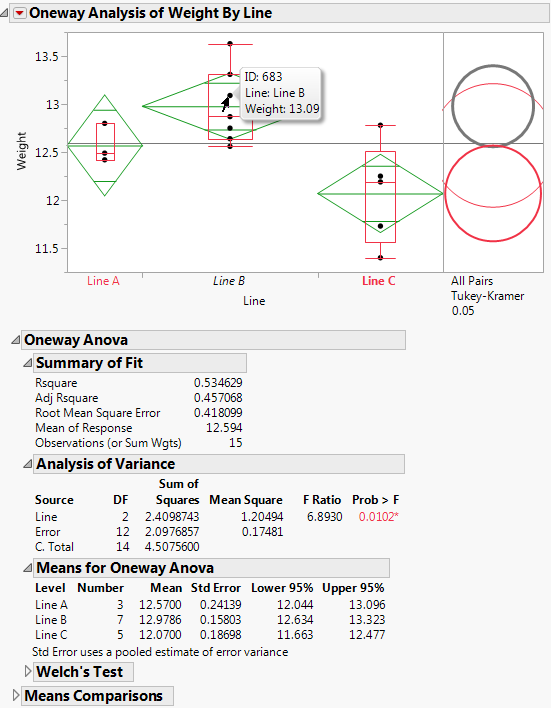
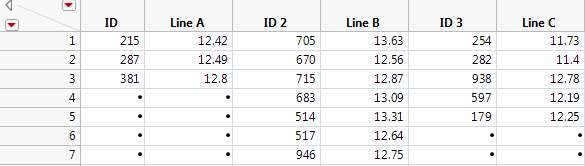
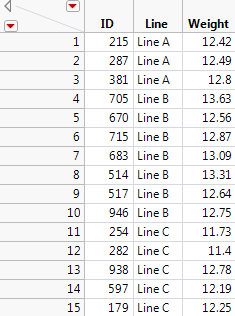
Your new data table is now properly structured for JMP analysis. Each row contains data for a single cereal box. The first column gives the box ID, the second gives the production line, and the third gives the weight of the box (Recoded Data Table).
|
•
|
Label points by ID in case you want to reweigh or further examine their boxes.
|
Before beginning, verify that you are using the Stacked data table.
|
1.
|
Select Analyze > Fit Y by X.
|
|
2.
|
|
3.
|
|
4.
|
Click OK.
|
|
5.
|
From the red triangle menu, select Means/Anova.
|
|
6.
|
From the red triangle menu, select Display Options > Box Plots.
|
|
7.
|
|
8.
|
In the plot, hover over the points with your mouse to see their ID values, as well as their Line and Weight data. See Oneway Analysis of Weight by Line.
|
|
9.
|
From the red triangle menu, select Compare Means > All Pairs, Tukey HSD.
|